
Figure 1. Gene network inference pipeline.
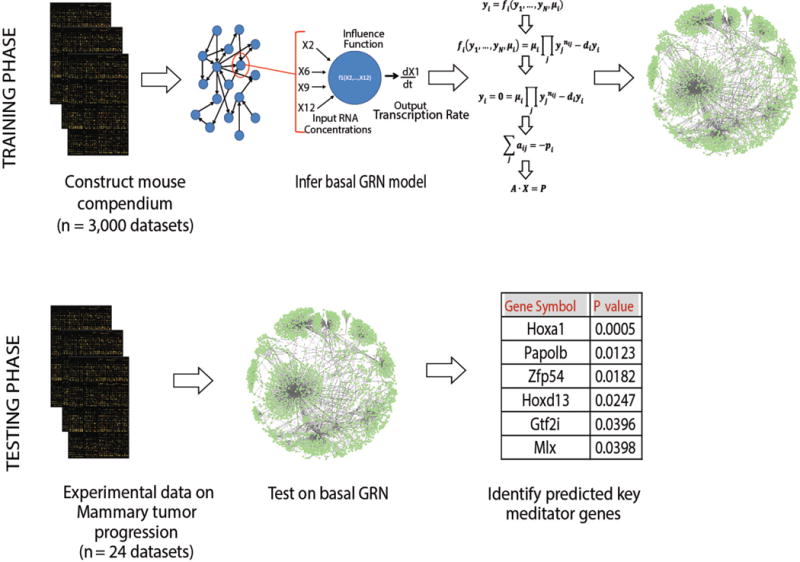
In the first phase, the MNI algorithm was trained on a compendium of 3000 mouse microarray data sets to construct a basal network connectivity model. Genome-wide expression data from wild type and 8 week-old transgenic mammary glands were then interrogated using the GRN model to pinpoint alterations in gene behavior that were unique to particular stages of tumorigenesis. The significance of the predicted key mediator genes of the disease stage of interest is quantified with a z-score. Two-tailed p-values are calculated based on the z-score value. Genes are ranked according to the p-value, and top-ranked genes are selected as probable key mediators of the disease state.