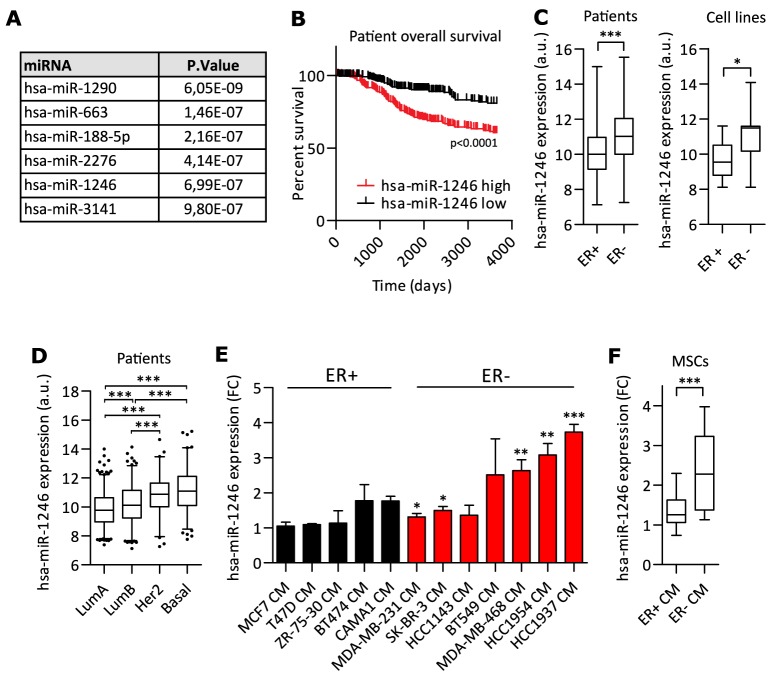
Figure 1. miR-1246 expression and regulation in MSCs and breast cancer.
A. miRNAs were ranked according to their significance of correlating with negative breast cancer patient survival (see Supplementary Table 1). A stringent p-value of < 1.0e-6 was applied to identify top six miRNAs with impact on negative breast cancer patient survival. B. Kaplan-Meier analysis was performed with miR-1246 using the METABRIC breast cancer dataset with n=257 for each quartile. C. miR-1246 expression analysis in ER+ vs. ER- patients (ER-: n=267, ER+: n=993) or cell lines (ER-: n= 12, ER+: n=8) (cell line specific expression in Supplementary Figure 1C). Data was retrieved from METABRIC dataset [70]. D. miR-1246 expression analysis according to molecular breast cancer subtypes Luminal A (LumA, n=481), Luminal B (LumB, n=315), Her2 positive (Her2, n=127) and basal like (Basal, n=211). Data was retrieved from METABRIC dataset [70]. E. and F. Regulation of hsa-miR-1246 expression in MSCs by CM of ER- and ER+ breast cancer cells. MSCs were starved o.n. and stimulated with cell line specific growth medium or conditioned medium (CM) for 14h with n=3 and hsa-miR-1246 expression was analyzed by qRT-PCR. Data was normalized and compared to expression of miR-1246 after stimulation with cell line-specific growth medium and is presented as bar chart for the specific cell lines (E) or as box plot for the groups ER+ versus ER- CM (F). Data is presented as mean ± SD. * represents p < 0.05; ** represents p < 0.01; *** represents p < 0.001.

