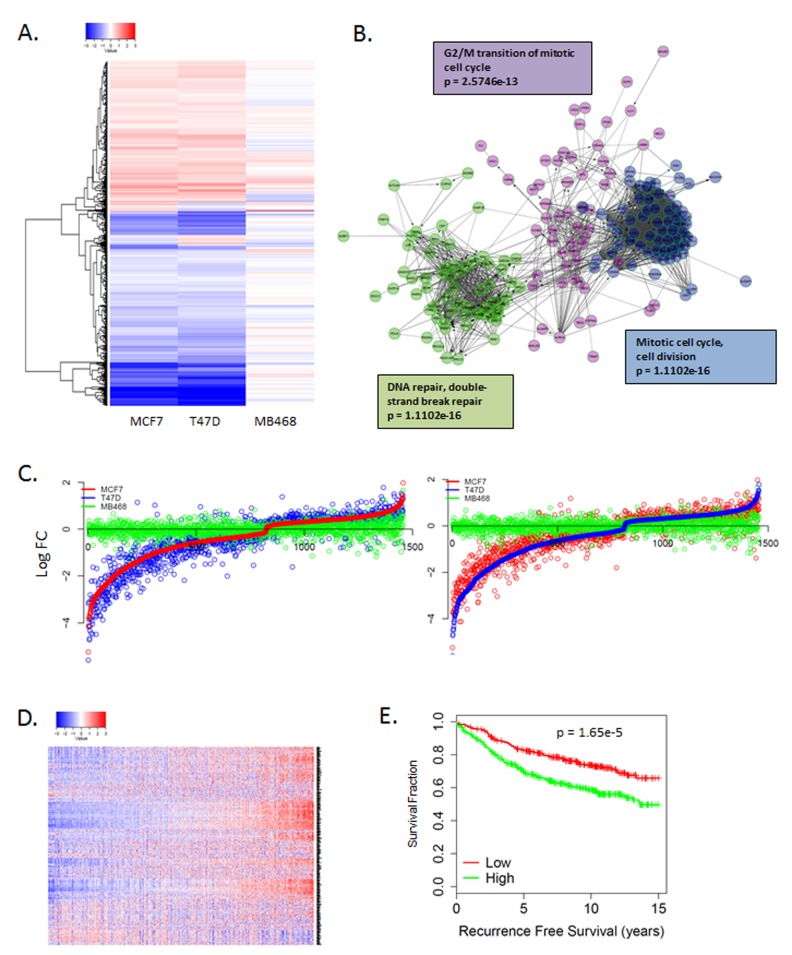
Figure 2. Unbiased gene expression response to CDK4/6 inhibition.
A. Heatmap illustrating gene expression changes that occurred in MCF7 or T47D vs. MB468 cells with 250 nM abemaciclib. Data are from triplicate experiments. B. Network analysis of genes repressed by abemaciclib demonstrating key enrichment of genes regulating cell cycle transitions. C. Comparison of gene expression changes in MCF7, T47D, and MB468 cells. Log fold change is plotted on the y-axis with a given gene indicated by the dot. D. Heatmap showing the coordinate expression of abemaciclib repressed genes in a collection of 967 ER+ breast cancers. E. Kaplan-meier curve shows the association of abemaciclib repressed genes with recurrence-free survival (n = 736).

