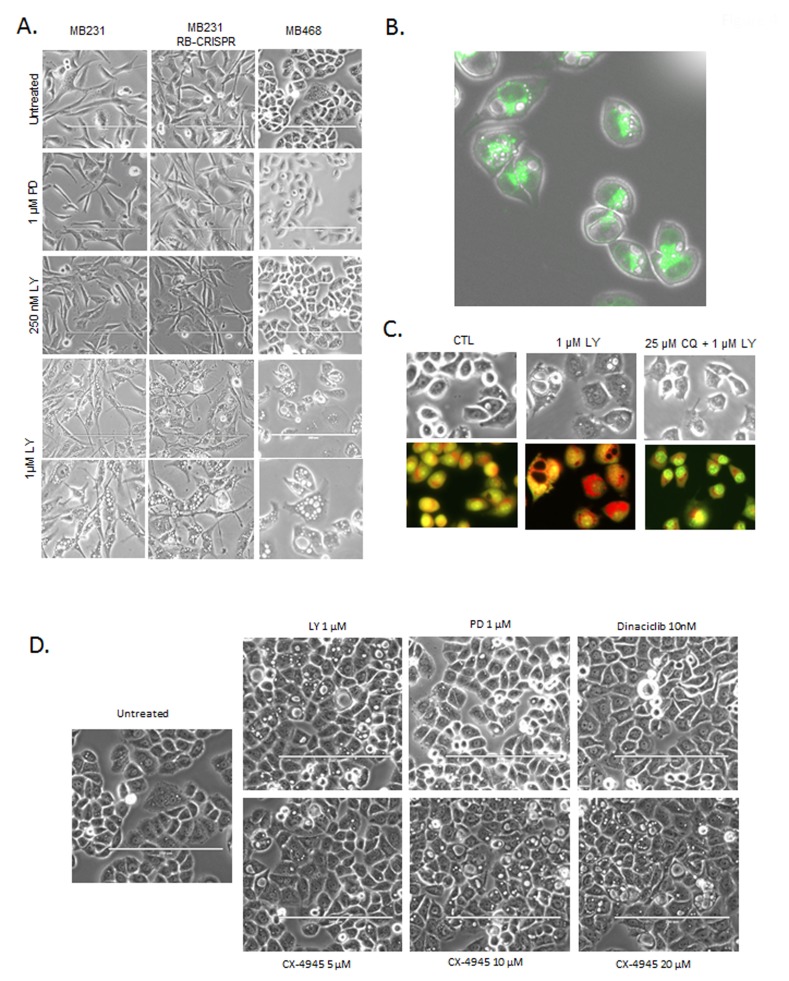
Figure 4. Defining RB-independent impacts of abemaciclib and cytotoxicity.
A. The indicated cell lines were treated with the indicated doses of palbociclib (PD) and abemaciclib (LY). Representative phase contrast micrographs are shown, with the bottom row showing further magnification of the 1 µM abemaciclib treated field. B. Lysotracker green was used to localize lysosomes relative to the vacuolar structures. Representative image of MB468 cells treated with 1 µM abemaciclib are shown, merged with the phase contrast image. C. MB468 cells were treated with the indicated agents and stained with acridine orange after 6 hours of treatment. Red staining-denotes the lysomal accumulation. D. Phase contrast images of cells treated with the indicated agents.

