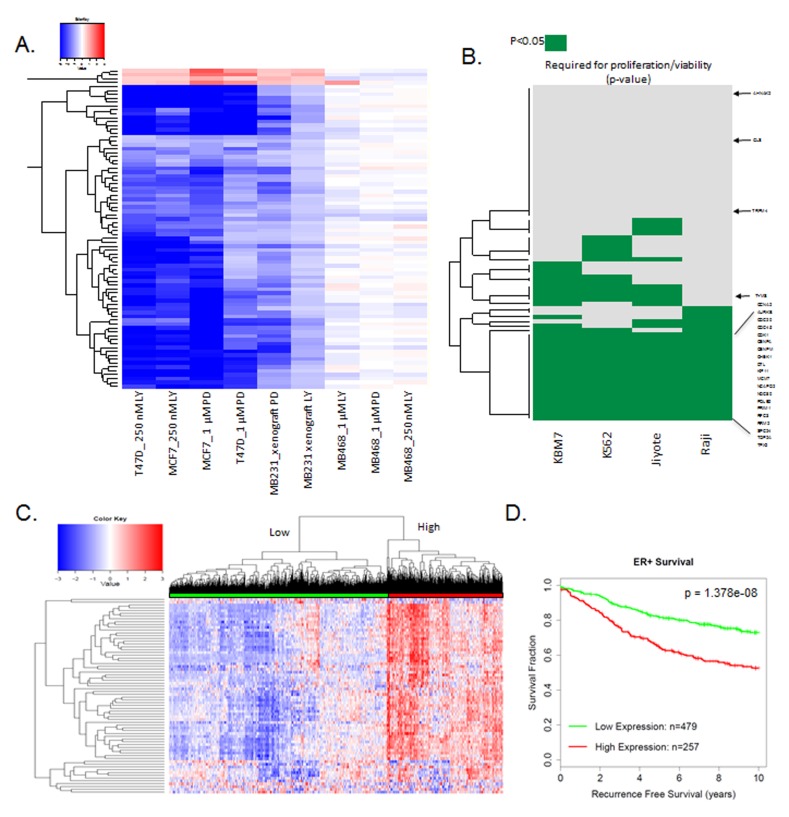
Figure 7. Composite response signature for CDK4/6 inhibitors.
A. Heatmap showing genes that are consistently altered with palbociclib (PD) and abemacicilb (LY) in RB-proficient models. RB-deficient MB468 model is shown as a control. B. Data plotting genes within the CDK4/6 response signature that are required for viability (p < 0.05) for the indicated cell lines. The CDK4/6 response signature genes are strongly associated with reduced viability/proliferation across all of the cell lines interrogated (two-sided test of equal proportions, p = 4.231703e-17). Select required genes are shown for reference C. Heatmap showing the relative expression of the CDK4/6 response signature across 967 ER+ breast cancer specimens. Two major clusters are identified. D. Kaplan-Meier curve dichotomized by the two major clusters observed in ER+ breast cancer specimens (log-rank p-value=1.378e-08).

