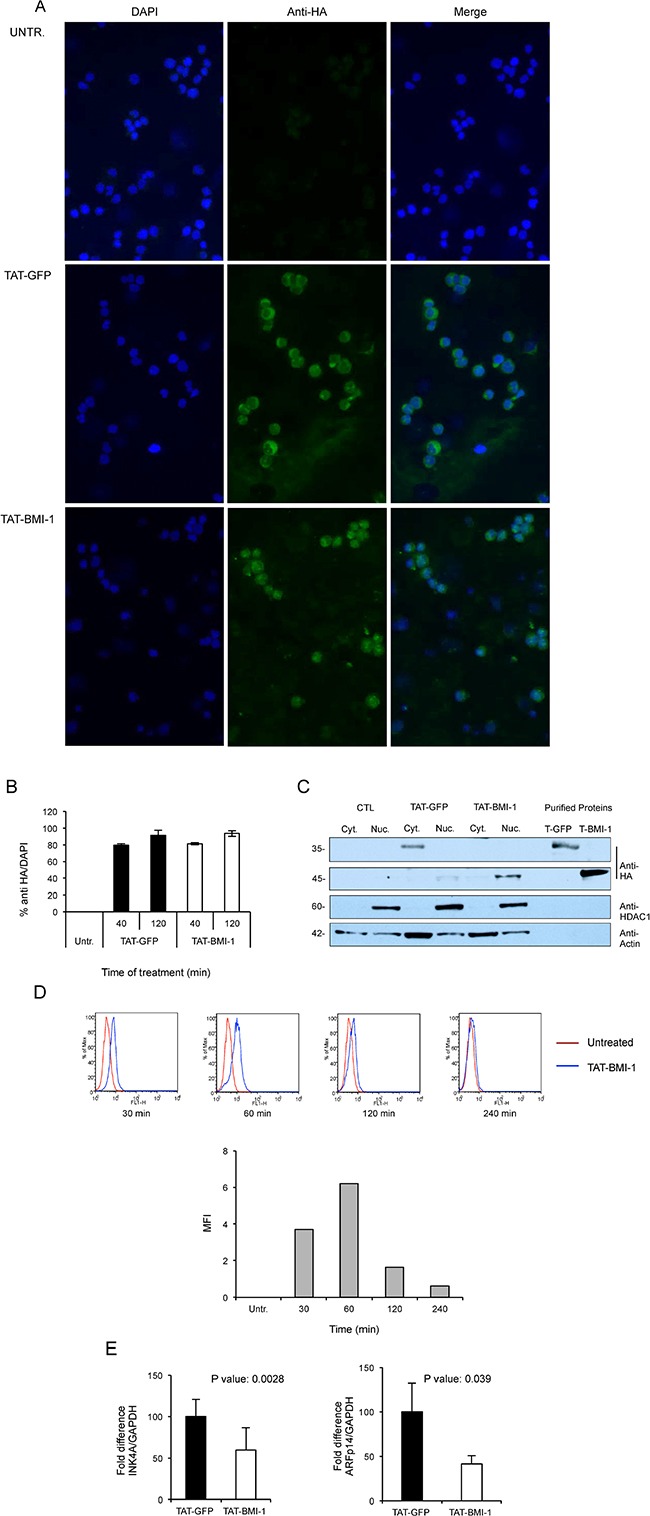
Figure 3. Uptake of TAT-proteins by cord blood derived CD34+ and K562 cells.

(A) Purified TAT-GFP or TAT-BMI1 proteins were added to cultures of CD34+ cells at a final 100 nM concentration for 40 min at 37°C. Cytospins were fixed and TAT-proteins were detected by indirect immunofluorescence with rabbit anti-HA and anti-rabbit Alexafluor 488 antibodies as detailed in Materials and Methods; cell nuclei were counter-stained with DAPI. (B) Uptake of TAT-GFP and TAT-BMI-1 in CB-CD34+ cells after 40 and 120 minutes of incubation. Treatment and immunofluorescence were performed as described above, and the percentage of HA-positive/DAPI-positive cells was determined using ImageJ. (C) Subcellular localization of TAT-proteins. K562 cells (2 × 10⁵/ml) were incubated with 100 nM TAT-fusion proteins for 20 min. Cytoplasmic and nuclear extracts were prepared as described in the materials and methods section, and analyzed by western blotting using an anti-HA antibody to reveal the TAT-fusion proteins, as well as anti-HDAC1 and anti-actin as markers of the nuclear and cytosolic protein fractions respectively. As it can be observed, TAT-GFP accumulates in the cytosolic fraction and TAT-BMI-1 in the nuclear fraction. As controls, 10 ng of affinity-purified TAT-GFP (T-GFP) and TAT-BMI-1 (T-BMI1) were also loaded. (D) Accumulation kinetics of TAT-BMI-1. K562 cells were incubated with 100nM protein and collected after 30, 60, 120 and 240 min. After intracellular staining with anti-HA antibody and Alexafluor 488-conjugated secondary antibody, FACS analysis was performed on a BD FaCScan (Beckton-Dickinson, Milan, Italy). In the top part of the panel, blue histograms represent TAT-BMI-1-treated cells compared to (red histograms) untreated cells. The mean fluorescence intensity (MFI) values determined at each time point, minus the MFI of untreated cells, are shown in the graph in the lower part of the panel. (E) TAT-BMI-1 down-regulates INK4A expression. 1 × 10⁵ CD34+ cells were stimulated for 3 days with repeated additions of 10 nM TAT-BMI-1. RNA was extracted and the INK4A and ARF mRNA levels were analyzed by RT-Q-PCR using GAPDH as a normalizing gene.
