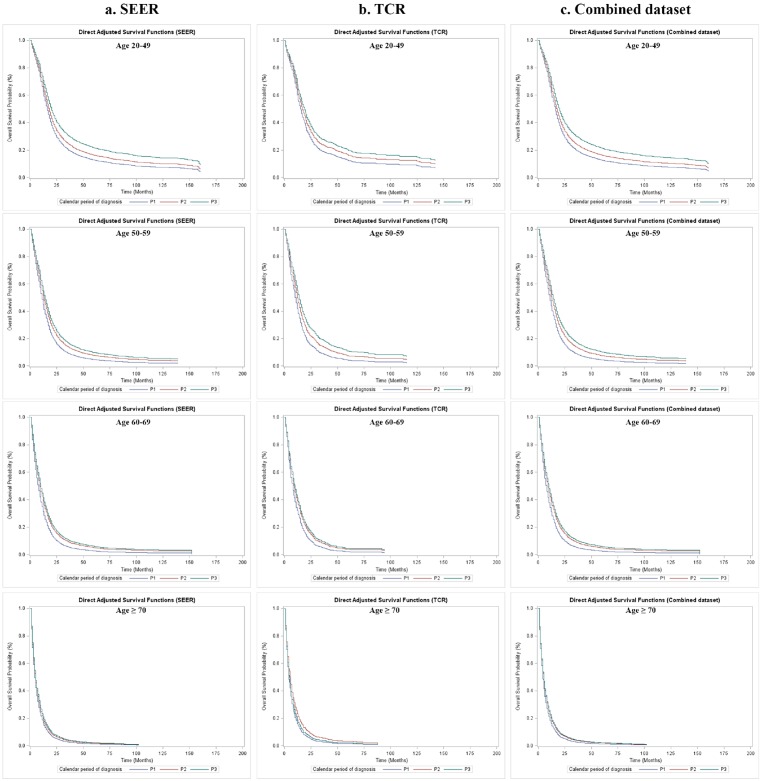
Figure 3. Overall survival of GBM patients by calendar period of diagnosis and age group at diagnosis in SEER, TCR and the combined dataset, direct adjusted survival functions.
(a) Direct adjusted survival after adjusting covariates stratified by age group at diagnosis in SEER; (b) Direct adjusted survival after adjusting covariates stratified by age group at diagnosis in TCR; (c) Direct adjusted survival after adjusting covariates stratified by age group at diagnosis in the combined dataset.

