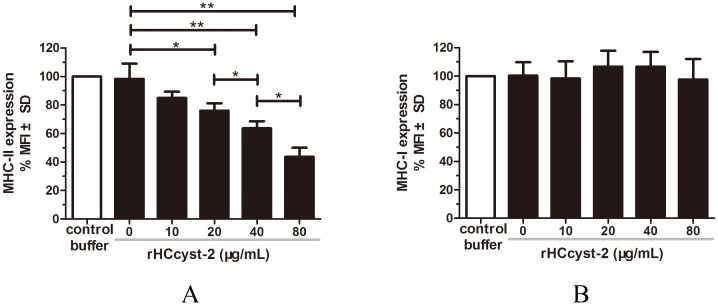
Figure 7. rHCcyst-2 inhibits MHC-II expression on goat monocytes.
Monocytes were cultured in the presence of control buffer (PBS/DTT) or different concentrations of rHCcyst-2 for 24 h. MHC-II expression was measured by flow cytometric analysis and calculated as the percentage of mean fluorescence intensity (MFI) of controls. Bars represent the MFI ± SD of controls. (A) MHC-II; (B) MHC-I. The data are representative of three independent experiments (*p < 0.05, **p < 0.01, ***p < 0.001).

