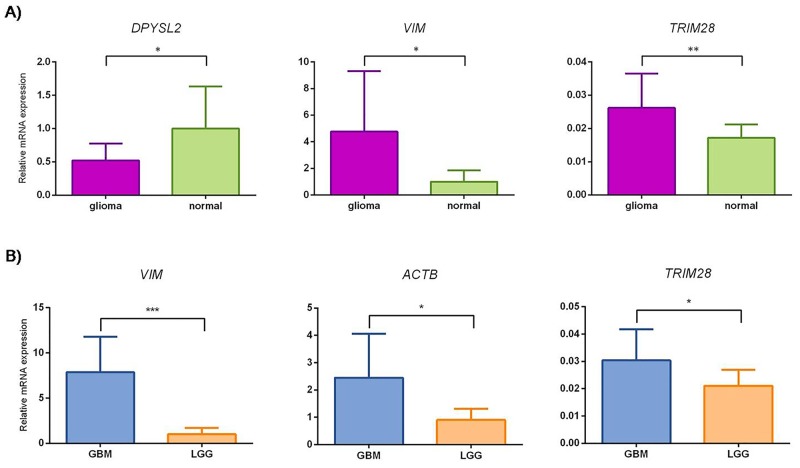
Figure 6. Small scale confirmatory study of relative mRNA expression levels for DPYSL2, VIM, TRIM28 and ACTB.
The mean gene expression value corresponds to column height, with error bars representing SD. (A) glioma, gliomas WHO grade II, III and GBM; normal, reference samples. *, P <0.05, **, P <0.01. Mann-Whitney test showed statistically different change in expression for DPYSL2 and VIM with P values 0.0158 and 0.0107, respectively. Student's t-test showed statistically different change in expression for TRIM28 with P value 0.0033. (B) GBM, glioblastoma; LGG, lower grade gliomas. *, P <0.05, ***, P <0.001. Mann-Whitney test for ACTB, TRIM28 and VIM showed statistically different changes in expression with P values 0.0258, 0.0237 and 0.0002, respectively.

