
Figure 2. Effect of WJHL on the main organ index of CIA mice.
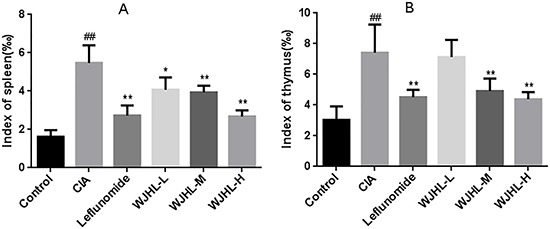
Values are the mean ± SEM (n = 10). *P < 0.05, *P < 0.01 compared with the CIA group; #P < 0.05, ##P < 0.01 compared with the control group. (A) Index of spleen. (B) Index of thymus.
Official websites use .gov
A
.gov website belongs to an official
government organization in the United States.
Secure .gov websites use HTTPS
A lock (
) or https:// means you've safely
connected to the .gov website. Share sensitive
information only on official, secure websites.
Values are the mean ± SEM (n = 10). *P < 0.05, *P < 0.01 compared with the CIA group; #P < 0.05, ##P < 0.01 compared with the control group. (A) Index of spleen. (B) Index of thymus.