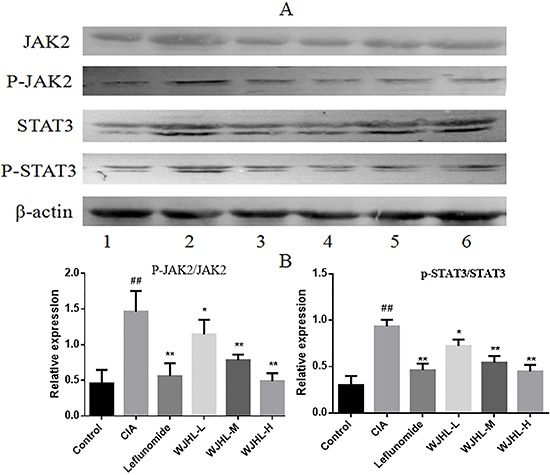
Figure 8. Protein expressions of JAK2, p-JAK2, STAT3, and p-STAT3 in synovial tissues of CIA mice.

Values are the mean ± SEM (n = 10). *P < 0.05, *P < 0.01 compared with the CIA group; #P < 0.05, ##P < 0.01 compared with the control group. (A) Representative western blot showing the protein expression of JAK2, p-JAK2, STAT3, and p-STAT3. 1: Normal group. 2: CIA group. 3: Leflunomide group. 4: High-dose of WJHL group. 5: Medium-dose of WJHL group. 6: Low-dose of WJHL group. (B) Relative intensity values from band densitometry of p-JAK2/JAK2 and p-STAT3/STAT3.
