
Figure 9. Relative expressions of JAK2, STAT3, IL-17A, RORγt, Foxp3, and OPG mRNA in synovial tissues of CIA mice.
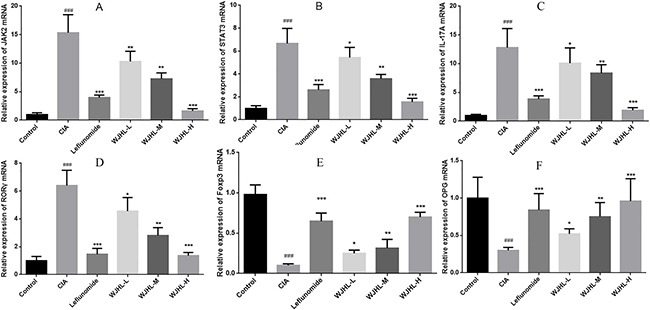
Values are the mean ± SEM (n = 10). *P < 0.05, *P < 0.01, and ***P < 0.001 compared with the CIA group; #P < 0.05, ##P < 0.01, and ###P < 0.001 compared with the control group. (A) JAK2 mRNA expressions (B) STAT3 mRNA expressions (C) IL-17A mRNA expressions (D) RORγt mRNA expressions (E) Foxp3 mRNA expressions (F) OPG mRNA expressions.