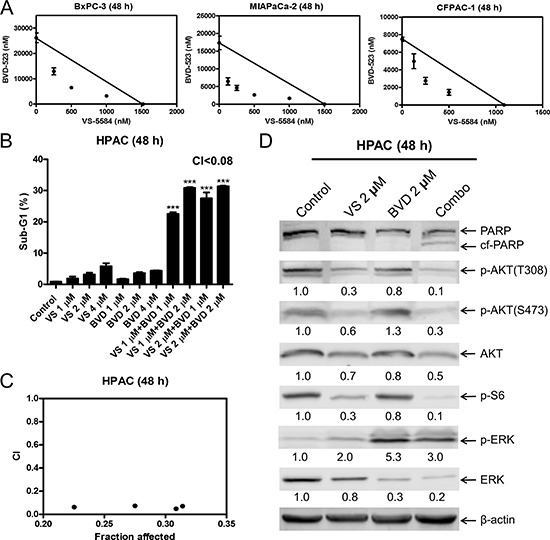
Figure 5. BVD-523 synergizes with VS-5584 in AML cells.

(A) BxPC-3, MIAPaCa-2, and CFPAC-1 cells were treated with vehicle control or variable concentrations of BVD-523 and VS-5584, alone or in combination, for 48 h. Viable cells were measured by MTT assays. Standard isobologram analyses of the antitumor interactions are shown. The IC50 values of each drug are plotted on the axes; the solid line represents the additive effect, while the points represent the concentrations of each drug resulting in 50% inhibition of proliferation. Points falling below the line indicate synergism whereas those above the line indicate antagonism. (B) HPAC cells were treated with vehicle control, VS, BVD-523 (BVD), or VS plus BVD for 48 h. Cells were fixed with 80% ice-cold ethanol and stained with PI for cell cycle analysis. The percentage of cells with sub-G1 DNA content are graphed as means of triplicates ± SEM from one representative experiment. ***indicates p < 0.001; combined treatment compared to individual treatments and vehicle control. Combination index (CI) values were calculated using CompuSyn software. (C) CI vs. Fa plot (combination index vs. fraction affected) for the cell death data is presented. (D) HPAC cells were treated with vehicle control or the indicated drugs for 48 h. Whole cell lysates were subjected to Western blotting and probed with the indicated antibody. The fold changes for the densitometry measurements, normalized to β-actin and then compared to no drug treatment control, are indicated.
