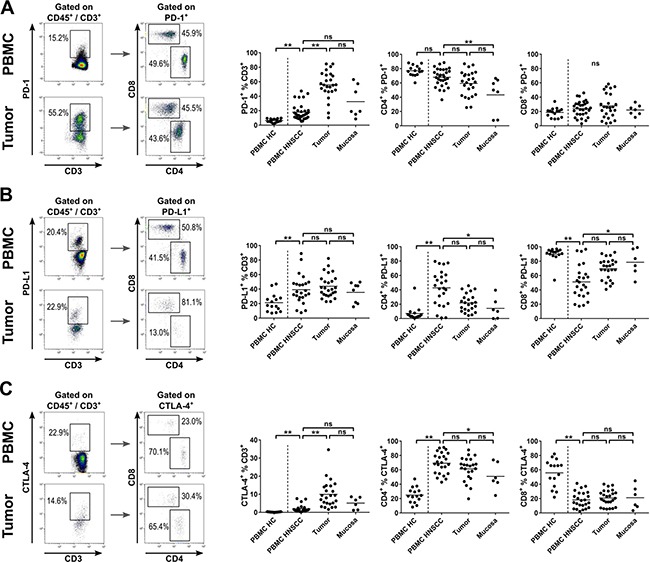
Figure 3. Expression of immune checkpoint molecules on T cells in HNSCC patients.

T-cell subsets in PBMCs of healthy controls (PBMC HC, n = 15), PBMCs of HNSCC patients (PBMC HNSCC, n = 32), single cell suspensions of tumor tissue (n = 31) and non-cancerous mucosa (n = 7) were analyzed by flow cytometry for immune checkpoint molecule expression. (A) Exemplary flow cytometry analysis of PD-1 expression in PBMC and tumor tissue of HNSCC. PD-1 expressing T cells were subcategorized according to their membranous CD4 and CD8 expression, as shown in dot plot graphs on the left side. Scatter plots comparing the percentage of PD-1 expressing cells within the T-cell fraction in PBMC HC, PBMC HNSCC, tumor tissue and mucosa (middle). The two scatter plot graphs on the right side show the percentage of CD4+ and CD8+ T cells within the PD-1+ T-cell fraction. (B) Similar to (A), exemplary dot plots of PD-L1 expressing T-cell subsets are depicted on the left side. Percentages of PD-L1 expressing T cells and CD4+ and CD8+ PD-L1+ T-cell subsets are shown in scatter plots on the right side (comparing PBMC HC, PBMC HNSCC, tumor tissue and mucosa in each graph). (C) Similar to (A), gating of CTLA-4+ T cells and subsets (CD4+ and CD8+) is shown on the left side. The percentage of CTLA-4 expressing T cells and CD4+ and CD8+ subsets within this fraction are depicted in scatter plots on the right side. For statistical analysis, one-way ANOVA was used in middle and right plot of (A) and (C) and left plot of (B). Kruskal-Wallis test was used for all remaining analyses. The mean of every dataset is depicted. *P < 0.05; **P < 0.005; ns, not significant.
