
Figure 4. Lymphocyte infiltration and T-cell subsets in HPV positive and HPV negative HNSCC.
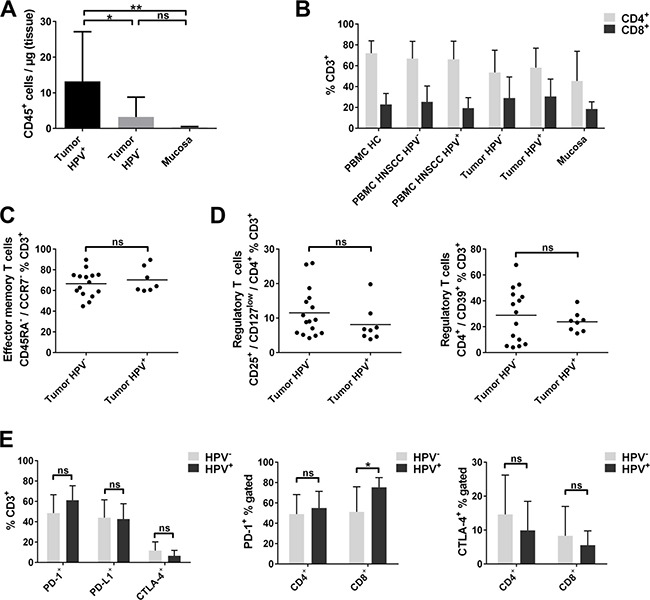
(A) Flow-cytometric analysis of CD45+ cells per μg tissue in HPV positive HNSCC tumors (n = 8), HPV negative HNSCC (n = 26) and non-cancerous mucosa of the same patients (n = 7). (B) Percentages of CD4+ and CD8+ cell subsets within the CD3+ T cells compared in PBMC of healthy donors, PBMC and tumor tissue of HPV negative and HPV positive HNSCC patients and non-cancerous mucosa. (C) Effector memory T-cell subsets (CD45RA−/CCR7−) are compared in tumor tissue of HPV positive and negative HNSCC. (D) Comparison of percentages of different regulatory T-cell phenotypes CD4+/CD25+/CD127low and CD4+/CD39+ in HPV positive and negative HNSCC tumor tissue. (E) Overview of checkpoint molecule expressing T cells (PD-1, PD-L1 and CTLA-4) in the tumor microenvironment of HPV positive and negative HNSCC (left plot); percentages of PD-1+ and CTLA-4+ T cells in the CD4+ and CD8+ T-cell fraction of HPV positive and negative HNSCC tumor tissue (middle and right plot). Kruskal-Wallis test was used in (A) and t tests were performed in (C), (D) and (E). Data is depicted as mean ± standard deviation. *P < 0.05; **P < 0.0001; ns, not significant.