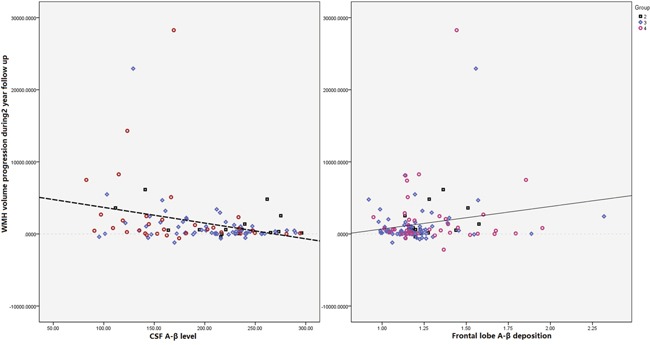
Figure 2. Scatter plot diagram of correlation between progression of total WMH (unit: ml) and neuropathological data (measured by CSF and PiB PET).

Our results showed that both Aβ in CSF (R=-0.0224, P=0.011) and PiB-PET assessed Aβ deposition in frontal lobe (R=-0.185, P=0.032) were significantly correlated with progression of WMH volume.
