
Figure 4. Colonic IL-1β (A) and TNF-α (B) levels of four groups.
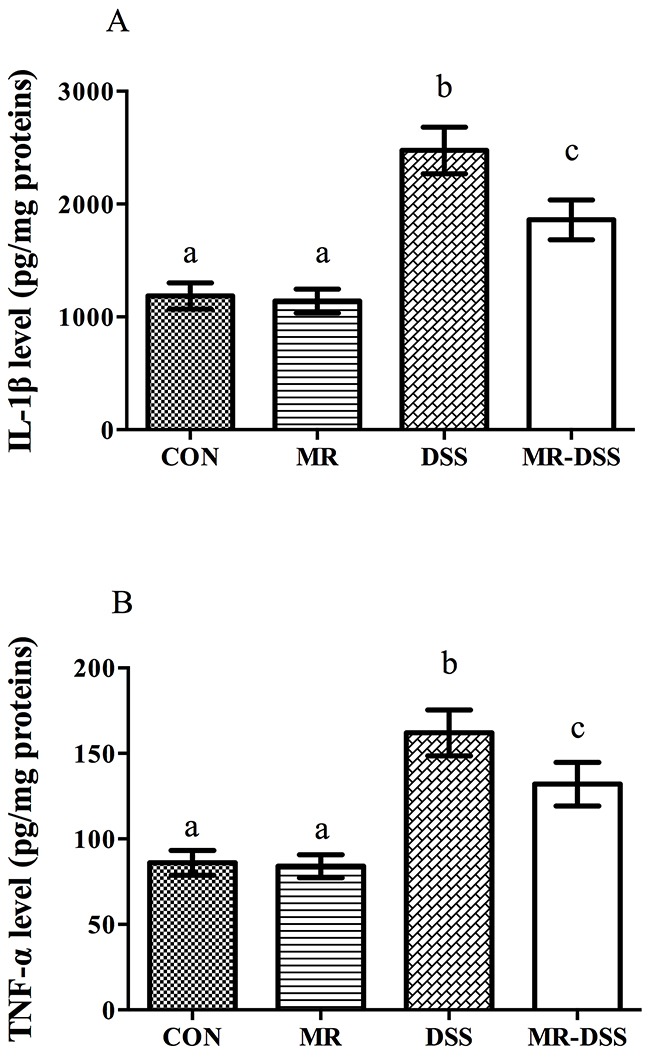
Data are presented as the mean ± SEM. Values with different superscript letters were significantly different (P < 0.05; n = 8).
Official websites use .gov
A
.gov website belongs to an official
government organization in the United States.
Secure .gov websites use HTTPS
A lock (
) or https:// means you've safely
connected to the .gov website. Share sensitive
information only on official, secure websites.
Data are presented as the mean ± SEM. Values with different superscript letters were significantly different (P < 0.05; n = 8).