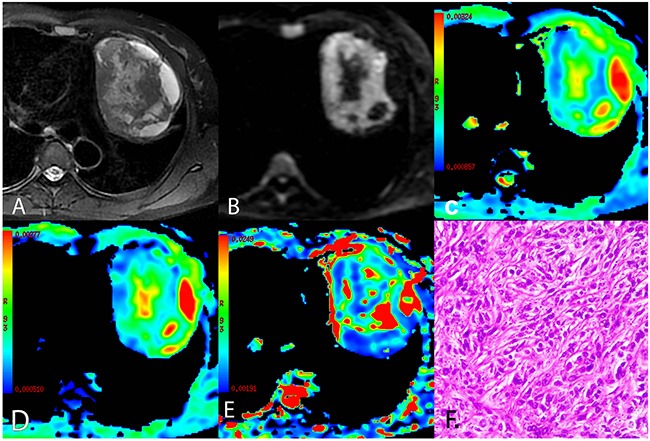
Figure 1. A representative case of low risk thymoma (type A).

(A) Axial T2-weighted fat-suppressed MR image showing left-sided anterior mediastinal mass with an oval shape and smooth contours containing central cystic areas and peripheral cyst-like changes. (B) Diffusion-weighted trace image (b = 1000 sec/mm2) showing high signal intensity in solid parts and lower signal intensity in cystic areas of the tumor. (C-E) ADCmb maps, D maps, and D* maps showing varying ADCmb, D, and D* values in different parts of the tumor (parametric values increase as color changes from dark blue to red). (F) Histological image showing diffuse growth of short spindle cells with bland nuclei (HE, 200 ×). ADCmb = ADC calculated using mono-exponential model DWI (multi b-values: 0 - 1200 sec/mm2); D = ADCslow or pure diffusion coefficient; D* = ADCfast or pseudo-diffusion coefficient.
