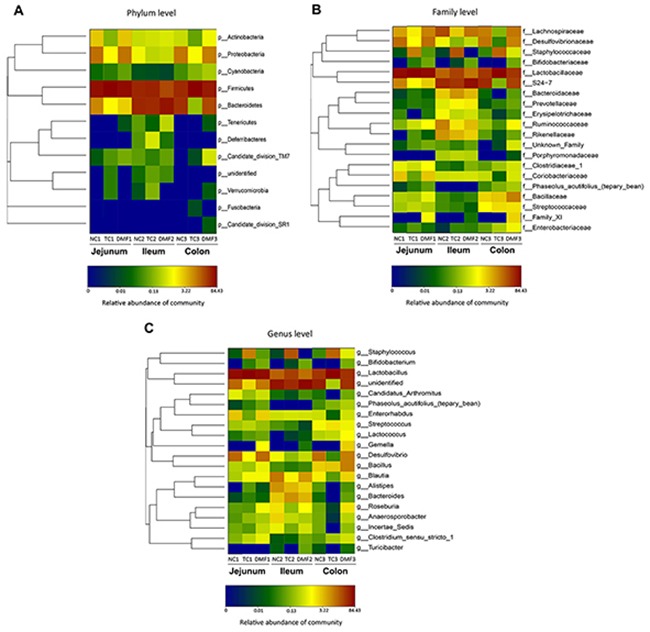
Figure 5. Double hierarchical dendrogram to illustrate effects of DMF on jejunal, ileal and colonic bacterial community of BALB/c mice.

The distribution of luminal bacteria in the jejunal, ileal and colonic digesta in different treatments were analyzed from phylum (A), family (B) to genus (C) level, respectively. The bacterial distribution among the samples bacterial phylogenetic tree was calculated by using the neighbor-joining method and the relationship among samples was determined by Bray distance and the complete clustering method. The heatmap plot depicts the relative percentage of each bacteria are depicted by color intensity with the legend indicated at the bottom of the figure. Clusters based on the distance of the eight samples along the X-axis and the bacterial families along the Y-axis are indicated in the upper and left of the figure, respectively. NC: negative control; TC: traditional control; DMF: dimethyl fumarate.
