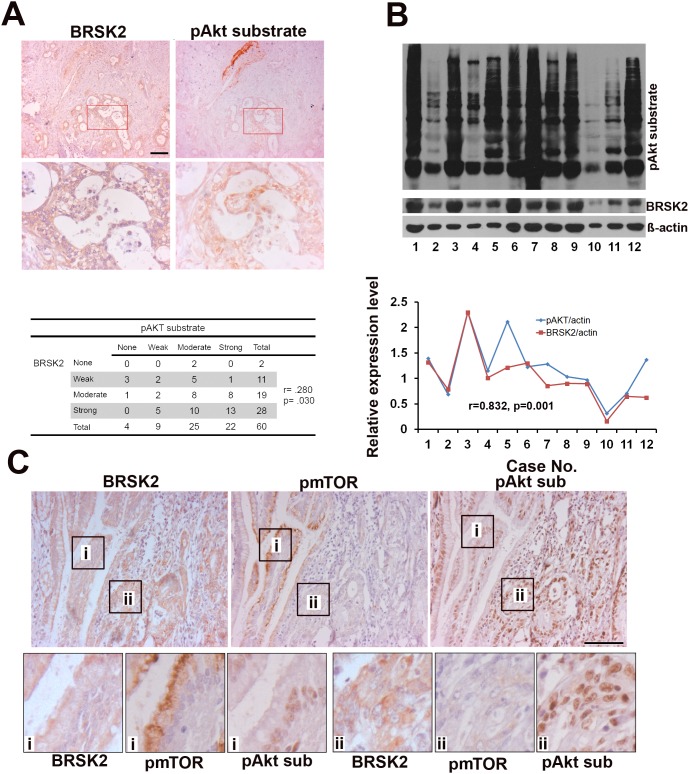
Figure 4. The relationship of BRSK2, pAkt substrate and pmTORS (2448) in cancer cells of human PDAC tissues.
(A) BRSK2 and pAkt substrate expression pattern in PDAC and the correlation of BRSK2 and pAkt substrate expression by IHC. Scale bar, 100μm. (B) The detection of BRSK2 and pAkt substrate expression levels in PDAC tissues with western blotting. The expression levels of BRSK2 and Akt activity were correlated in PDAC tissues (n=12). (C) BRSK2, pAkt substrate and pmTOR (Ser2448) expression pattern in consecutive sections of PDAC tissues. Scale bar, 200μm.

