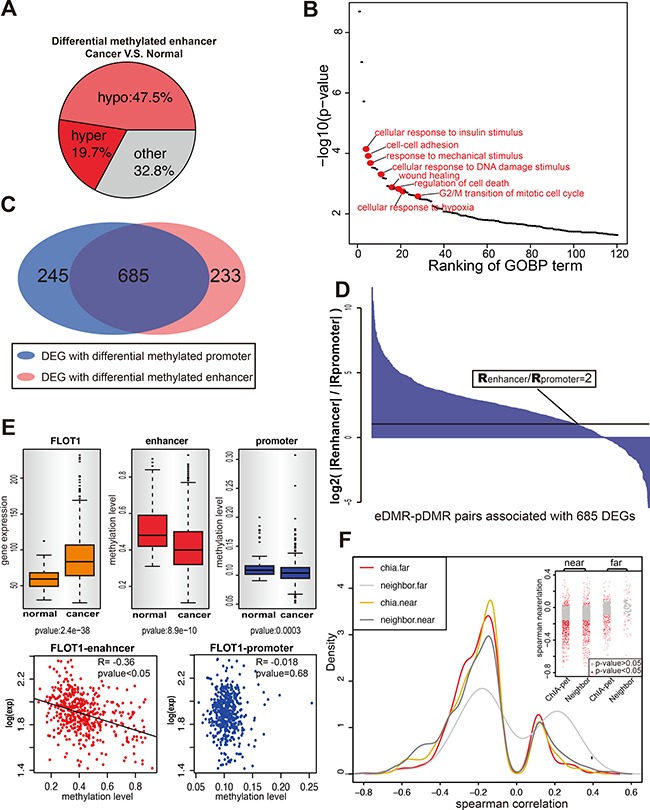
Figure 1. Identification of eDMRs and the target genes in breast cancer.

(A) The differentially methylated enhancers (t-test p value < 0.05) in malignant breast tissues are shown as three categories: hypermethylated, hypomethylated and others. (B) Gene ontology result shows eDMR target DEGs are enriched with cancer related genes. Each dot represents one GOBP term (p < 0.05), and the red ones are cancer-related. (C) Most of DEGs in 2429 E-P pairs are differential methylation for both enhancer and promoter when compare breast tumor to breast normal samples (TCGA). Venn diagram shows the number of DEGs for each part. (D) For the DEGs with both enhancer and promoter differential methylation, the enhancer methylation status takes the leading role of gene expression regulating. The ratio of Spearman correlation between enhancer methylation and gene expression to the Spearman correlation between promoter methylation and gene expression is indicated by the height of each bar. Each bar represents one enhancer-promoter pair. More than one pairs were counted when genes interact with multiple enhancers. The black line is the cutoff of ratio equals 2. (E) An example to show rather than promoter, enhancer methylation correlates with gene expression. The upper panel shows the expression of gene FLOT1 and the methylation of its enhancer and promoter in normal and cancer samples. The lower panel shows the correlation between gene expression and methylation of enhancer and promoter. (F) ChIA-PET is advanced in identifying remote enhancer-target pairs. Figure shows the distribution of Spearman correlation of E-P pairs identified by ChIA-PET (Red, > 100kb; Yellow, < 100kb) and E-P pairs whose promoters lied near by enhancers (Light Gray, > 100kb; Dark Gray < 100kb). The insert panel within the figure shows the Spearman correlation for each pair of each group. Every dot represents one E-P pair, and the gray region has p-value > 0.05.
