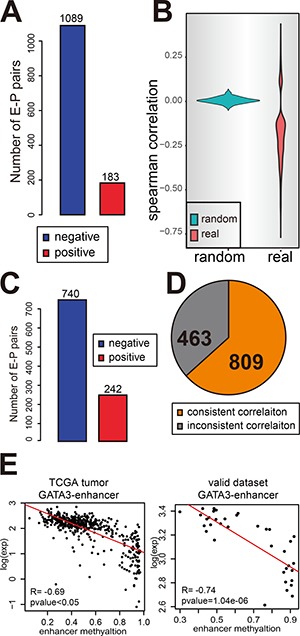
Figure 2. Enhancer methylation negatively correlates with gene expression.

(A and C) The number of negative correlated E-P pairs (blue) and positive correlated pairs (red) in TCGA breast cancer samples (A) and normal tissue samples (C). (B) The correlation between enhancer methylation and gene expression is not a random event. Figure shows the Spearman correlation for E-P pairs (p-value < 0.05) identified by ChIA-PET (red) and also random control pairs identified by randomly selected genes as target for each enhancer (green). (D) The result for enhancer methylation regulating gene expression can be repeated in validate dataset. The pie chart shows the portion of consistent result. (E) An example to show the consistent correlation in validating dataset and TCGA tumor samples.
