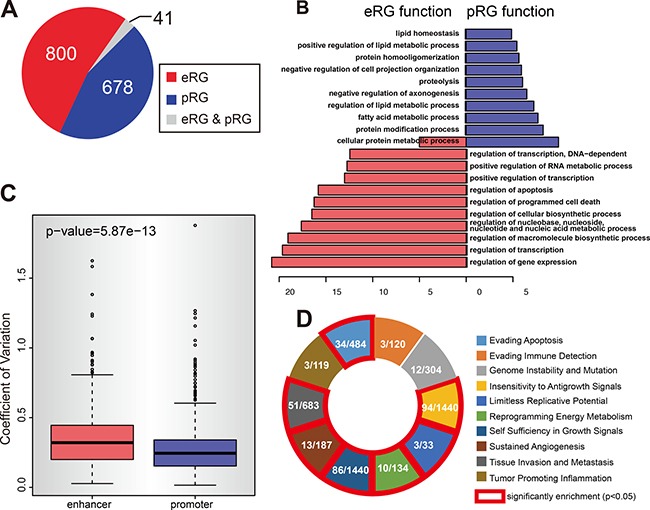
Figure 4. The divergent pattern of enhancer and promoter methylation in repressing gene expression.

(A) The methylation of enhancer and promoter regulate different type of genes. The pie chart shows the numbers of eRGs (enhancer regulated genes) and pRGs (promoter regulated genes). Gray part represents the genes that are both eRG and pRG. (B) eRGs and pRGs are different in function. Figure shows the gene ontology analysis result for eRGs and pRGs. Only the top 10 GO terms are shown for each type. (C) Enhancer methylation is more variable than promoter ones. Figure shows the coefficient of variation for all enhancers and promoters that are covered by 450k array. (D) eRGs are enriched in cancer hallmarks. Figure shows the enrichement result of eRGs for each cancer hallmark. In each box, shows the number of eRGs in hallmark (left) and the total number of genes in hallmark (right). Red line indicates significant enrichment (p-value < 0.05).
