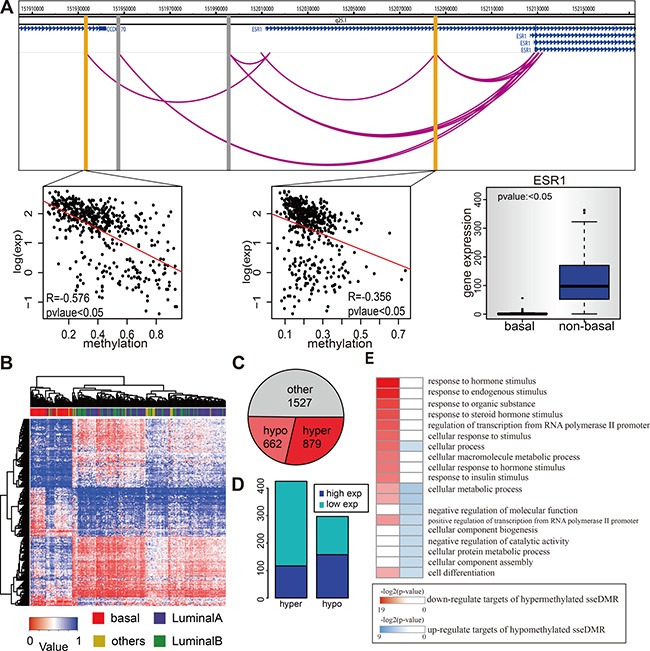
Figure 5. Enhancer methylation in different breast cancer subtypes.

(A) Methylation of ChIA-PET identified ESR1 enhancers are related with ESR1 expression. The genome figure shows the position of ESR1 and its four enhancers. The gray bars represent the enhancers whose methylation status is positive correlated with ESR1 expression, while the yellow bars represent the negative ones. The lower panel (from left to right) shows the correlation between enhancer methylation and ESR1 expression for those two negative correlated enhancers within TCGA tumor samples and also shows the ESR1 expression in basal and non-basal TCGA samples. (B) Enhancer methylation can distinguish the basal from non-basal samples. Figure shows hierarchical cluster of TCGA breast cancer dataset according to 1541 sseDMRs methylation status. Rows are the sseDMRs and columns are samples. The pathological classification of each sample is on the top. The color in the heatmap matrix is the methylation value. (C) The pie chart shows the number of enhancers that are hypermethylated, hypo-methylated, or no difference in basal samples comparing to non-basal samples. (D) The targets of hypermethylated enhancers tend to be low express in basal samples, and targets of hypomethylated enhancers tend to be high expressed. The diagram shows the number of genes for each type. (E) Genes actived by enhancer hypomethylation are functional different with those repressed by enhancer hypermethylation (basal V.S. non-basal). GO analysis results of these two type of genes are shown. Only top 10 go terms are shown for each type.
