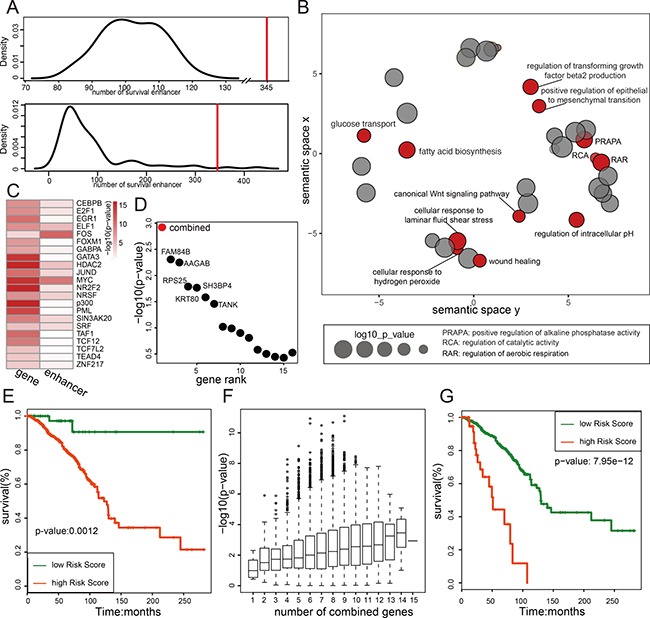
Figure 6. Enhancer methylation status predicts breast cancer risk.

(A) The number of survival related enhancer is larger than random. Figure shows two random analysis results, the upper panel is the number distribution of random regions whose methylation level related with patient overall survival (log-rank p-value < 0.05). The random region used here is selected as described in method; the lower panel is the number distribution of enhancers whose methylation level related with overall survival for perturbed patients. The red line is the number of survival enhancer in real data. (B) Genes regulated by methylation of survival enhancer are functional related with cancer. Go analysis result of these genes are shown in figure. The size of the node represents the enrichment p-value (shown in log), and red dots indicate the function associated with cancer. (C) The transcriptional factors enrichment result for promoters and enhancers of 120 targets of survival enhancer. (D) The combination of 15 breast cancer risk genes shows more effective on predicting patient overall survival. The log-ranked p-values of 15 breast cancer risks genes (black) and the combined p-values of all 15 genes (red) are shown in figure. (E) The overall survival curve for the combination of all 15 breast cancer risk genes. (F) The diversity of combination of 15 risk genes and the effect of them on prognosis. Figure shows all the log-rank p-value of combined survival analysis. The x-axis indicates the number of genes combined together in survival analysis. (G) The survival curve for the most significant combination model in survival analysis (The combination of gene CCDC83, PPFIBP2, KRT80, GADD45A, TANK, CCDC57, SLC34A1, RPS25 and TACC2).
