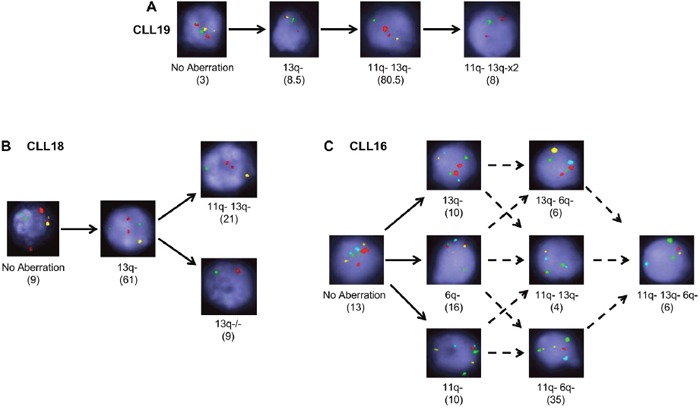
Figure 2. Multiplexed-FISH resolves both branching and linear evolution in CLL.

Multiplexed-FISH analysis enables establishment of the evolutionary history of a sample revealing that CLL populations undergo either (A) linear, (B) simple branching or (C) complex branching patterns of evolution. Original magnification ×100. Solid arrows denote the likely trajectory of evolution; dashed arrows denote possible trajectories. Numbers in brackets denote percentage of cells in that subclone. 6q- indicates del(6q); 11q-: del(11q); 13q-: del(13q); 13q−/−: del(13q)x2. Probe combinations were (A, B) 13q: yellow; 11q: green; 17p: red; (C) 13q: yellow; 6q: aqua; 11q: red; CEP11 (chromosome 11 control): green.
