
Figure 4. Recapitulation of patient cytogenetic profiles in CLL PDX models.
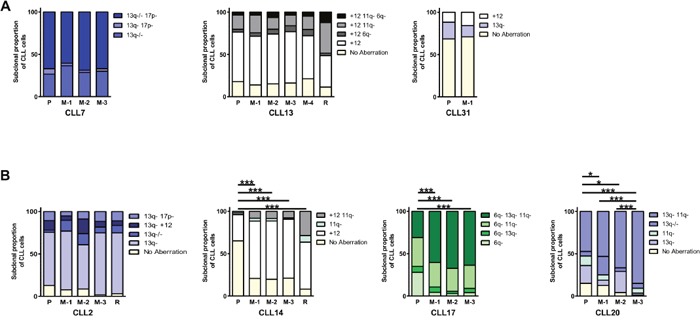
Irradiated (1.25Gy) NOG mice were intravenously co-injected with 2-5×10⁷ cells from a pre-treatment CLL sample and 1×10⁵ stimulated autologous T-cells. Multiplexed-FISH was used to assess the cytogenetic architecture of the patients’ pre-treatment sample (P), patients’ relapse (R) and FACS sorted cells from CLL PDX's (M) for seven tumors. This revealed that the subclonal cytogenetic composition of the input and engrafted cells could be either (A) highly similar (CLL7, CLL13, CLL31) or (B) significantly altered (CLL2, CLL14, CLL17, CLL20). M-1, M-2, M-3 and M-4 denote individual mice for each tumor (technical replicates). Cytogenetic aberrations are denoted as in Figures 1, 2 & 3. Statistical significance denoted by *P<0.05; ***P<0.005.