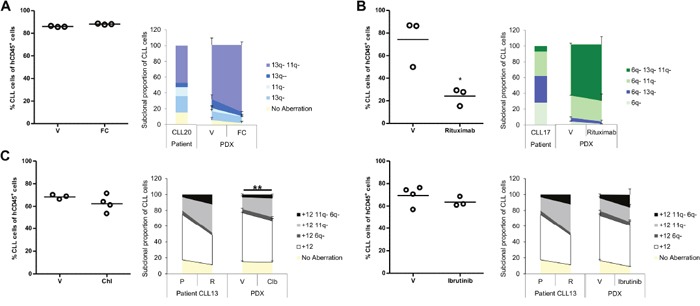
Figure 5. Effect of therapy on the cytogenetic architecture in CLL PDX models.

Subsequent to evidence that established PDX models were generated from 3 CLLs; usually one to two weeks after CLL/T-cell co-injection; they were treated under different protocols. Mice were sacrificed one week after fludarabine/cyclophosphamide, rituximab or chlorambucil treatment, or the day following cessation of ibrutinib treatment. Splenic tumor load was assessed by FACS analysis (left side of each panel). The cytogenetic architecture was derived from sorted splenic CLL cells (right side of each panel). (A) CLL20 PDX was treated with fludarabine and cyclophosphamide (0.625mg/kg and 6.25mg/kg, respectively; FC; n=3) or saline (vehicle; V; n=3) three times per week for two weeks. (B) CLL17 PDX was treated with rituximab (40mg/kg; n=3) or saline (V; n=3) three times over the course of a week. (C) CLL13 PDX was treated either with chlorambucil (5mg/kg; n=4) versus 3% DMSO (V; n=3) daily for five days (left panel) or with ibrutinib (12.5mg/kg; n=3) versus 1% methylcellulose/0.4% Cremephor EL (V; n=4) for nine days (right panel). Cytogenetic aberrations are denoted as in Figures 1, 2 and 3. Data are represented as mean ± SEM. Statistical significance denoted by *P<0.05; **P<0.01.
