
Figure 1. Kaplan-Meier curves of disease-free survival (DFS) (A) and overall survival (OS) (B) in the young population (N = 483) and the elderly population (N = 739).
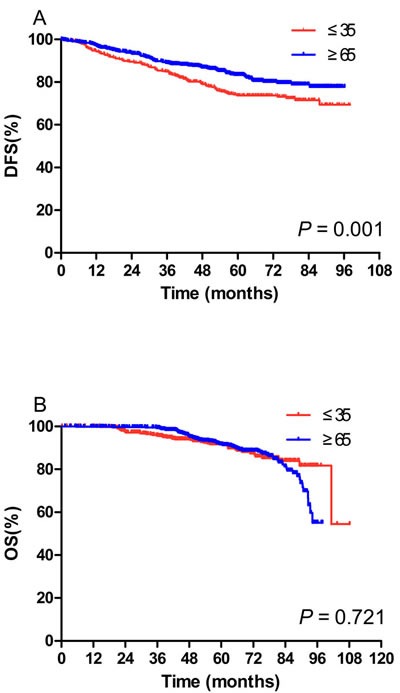
A. Patients in the young population had a significantly lower 5-year DFS (73.7% vs 83.4%, P = 0.001) (73.7% vs 83.4%, P = 0.001). B. No significant difference in 5-year OS1 was observed (91.7% vs 91.7%, P = 0.721).