
Figure 6. Deeks’ funnel plots for the assessment of potential bias in the meta-analysis for diagnosis.
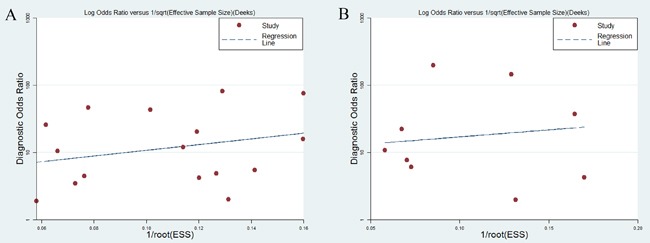
A. Funnel plot of the studies on miR-21 alone. B. Funnel plot of the studies on miR-21-related combination markers.
Official websites use .gov
A
.gov website belongs to an official
government organization in the United States.
Secure .gov websites use HTTPS
A lock (
) or https:// means you've safely
connected to the .gov website. Share sensitive
information only on official, secure websites.
A. Funnel plot of the studies on miR-21 alone. B. Funnel plot of the studies on miR-21-related combination markers.