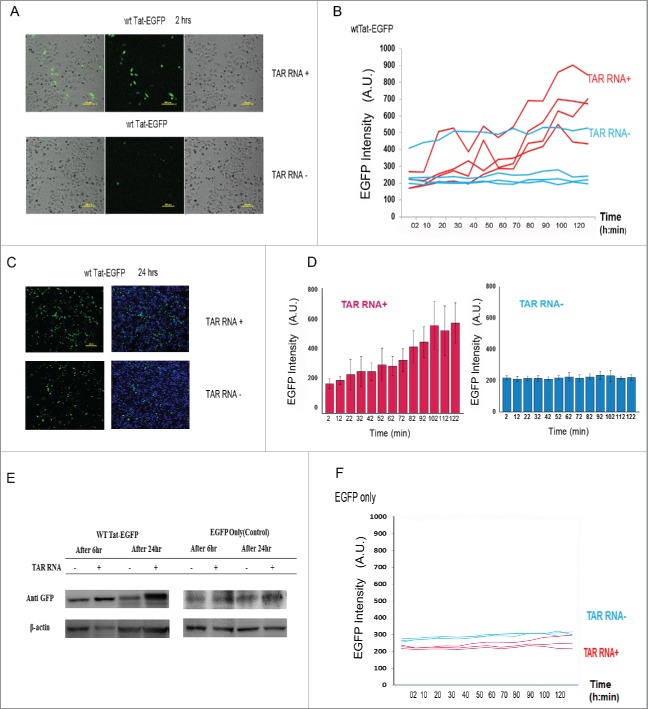
Figure 2.
Time course Tat folding by TAR RNA in HeLa cells. After transfection and 5 h of incubation, HeLa cells were co-transfected with plasmids encoding Tat-EGFP and TAR RNA and observed under time-lapse fluorescence microscopy at 10 min intervals for 2 h. (A) Merged images (40X, left) of the Differential Interference Contrast (DIC) and the fluorescence (GFP) after 3 h after transfection. (B) Time-dependent increase of EGFP based on a scatterplot of region of interest (ROI) corresponding to Videos S1–S3 of EGFP fluorescence in the control (blue) and TAR RNA co-expressed (red) cells. Time-lapse images of Tat-EGFP expression in HeLa cells at 4 independent positions were captured. Mean fluorescence of ROIs were traced using DIC (Differential Interference Contrast) covered the entire numbering field. (C) Overlaid image (10X) used to generate numbers of Tat-EGFP expressing cells 24 h after transfection. Scale bar, 200 μm. (D) Graphical presentation of Fig. 2B for the time dependent increases of Tat-EGFP expression in HeLa cells. (E) SDS-PAGE and western blot analysis of HeLa extracts for EGFP proteins. (F) Time-lapse fluorescence observations of EGFP expression with (red) and without TAR RNA co-expression (blue).

