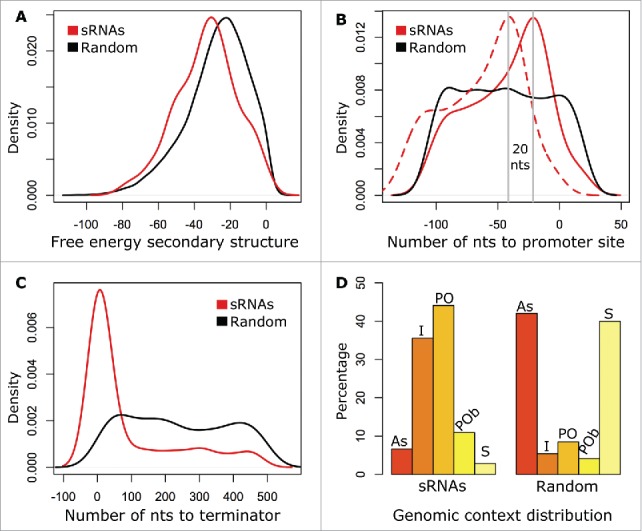
Figure 2.

Characteristics of putative sRNAs in comparison with the null distribution. (A) Probability distribution of the free energy of the predicted secondary structures for the putative sRNAs (red line) and 4,400 random genomic sequences of matching length and orientation (black line). The average free energy of the sRNAs' predicted secondary structures is statistically significantly lower than the average free energy of the random sequences' secondary structures (p = 5.902E-12, Mann-Whitney test). (B) Density function of the number of nucleotides (nts) upstream from the predicted 5′ end of the putative sRNAs to −10 (solid red line) and −35 (dashed red line) predicted promoter sites in comparison with the number of nts from the 5′ end of random genomic sequences to −10 predicted promoter sites (solid black line). (C) As B, but number of nts downstream from the predicted 3′ end of the putative sRNAs (red line) and of random genomic sequences (black line) to predicted Rho-independent terminators. (D) Proportion of sRNAs (left) and random genomic sequences (right) in a specific class of genomic context (antisense (AS), 28 sRNAs; intergenic (I), 150 sRNAs; partial overlapping (PO), 186 sRNAs; partial overlapping on both ends (POb), 46 sRNAs; and sense (S), 12 sRNAs).
