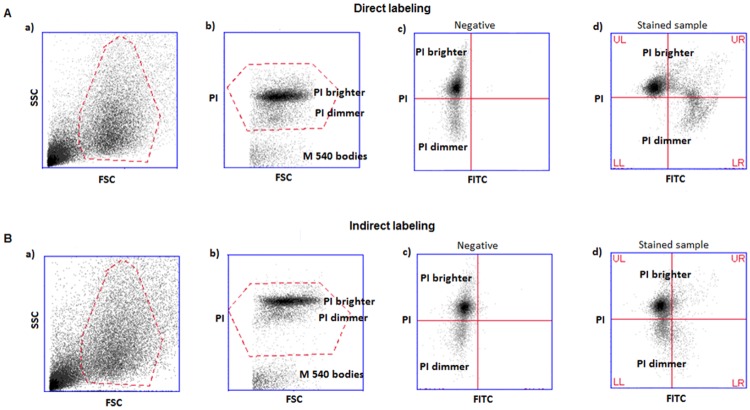
Fig 1. Example of dot plots obtained and strategy followed in TUNEL-FC analysis.
A) direct labeling and B) indirect labeling. a) FSC/SSC plots and flame shaped region (red) including spermatozoa and semen apoptotic bodies; b) PI/FSC plots and region (red) including PI-positive events (i.e. all spermatozoa) and excluding M540 bodies. Note the presence of two sperm populations with different PI staining intensity (PI brighter and PI dimmer); c) PI/FITC plots of negative control (without TdT enzyme), where quadrants are set; d) PI/FITC plots of a test sample, where TUNEL-positivity is calculated. Percentage of spermatozoa in UR quadrants reveals TUNEL-positivity of the PI-brighter population. Percentage of spermatozoa in LR quadrants reveals TUNEL-positivity of the PI-dimmer population. FSC-forward scatter, SSC-side scatter, PI- propidium iodide fluorescence, FITC-fluorescein isothiocyanate fluorescence, UL-upper left quadrant, UR-upper right quadrant, LL-lower left quadrant, LR-lower right quadrant. PI-dimmer and PI-brighter populations are indicated.

