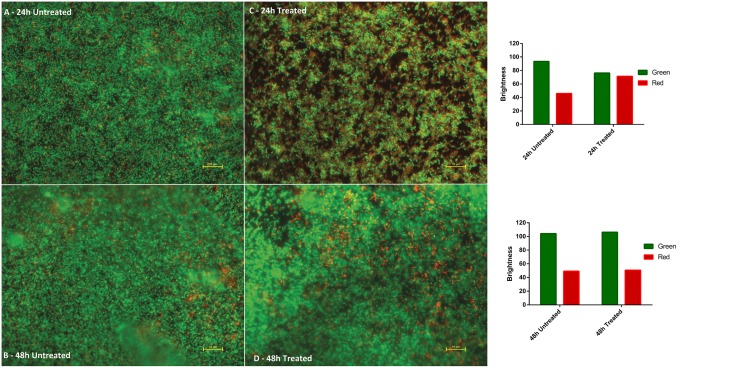
Fig 4. BacLight staining of P. aeruginosa DSM3227 biofilm at 24 h and 48 h.
Live cells appear green and dead/damaged cells appear red. Images A and B show development of extensive biofilm on untreated surfaces. Image C shows biofilm development on GS5 treated surface with a greater proportion of dead/damaged cells. Image D shows GS5 treated surface biofilm at 48 h: biofilm development and cell viability is similar to the untreated control. Images were obtained ×100 magnification (oil immersion) on a Nikon ECLIPSE E400 (Nikon) microscope utilising a dual-band emission filter (450–490 nm/510–560 nm) and NIS-Elements BR (Nikon) software; composite (red/green) images generated using Image J software. Scale bar = 10 μm. Brightness values were generated for each panel (fig 4 a/b/c/d) using ‘imageJ colour histogram analysis’ software which converts RBG pixels to brightness values (V = (R+G+B)/3). These red/green brightness values are presented as bar charts to the right of the micrographs.

