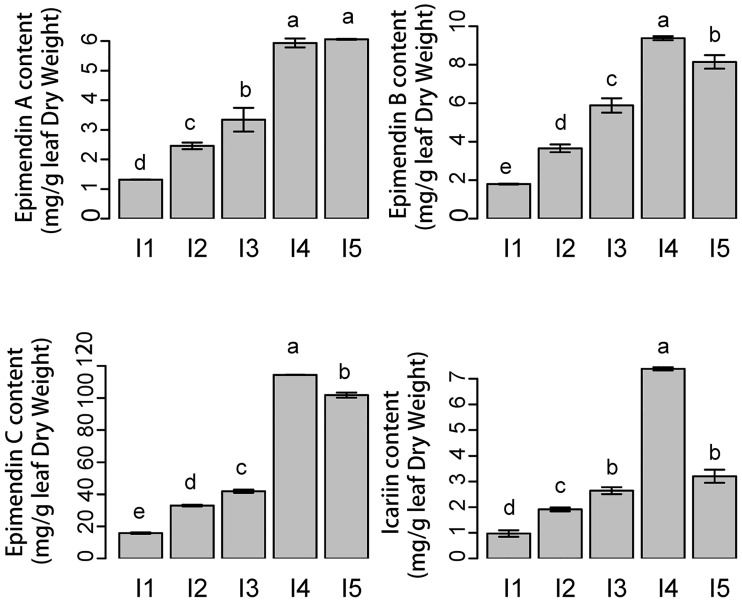
Fig 1. The amounts of Epimedin A, Epimedin B, Epimedin C and Icariin in E. pseudowushanense under different light intensities.
The data are expressed as the mean±SD. Different letters (a, b and c) indicate significant differences among groups with different light intensity treatments (p≤0.05; n = 30).

