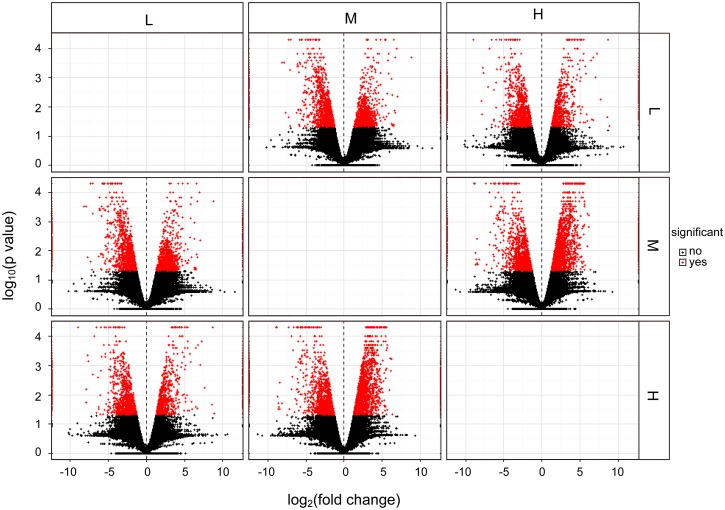
Fig 7. Volcano plot showing the distribution of log10(p value) vs. log2(Fold Change).
The horizontal axis represents the log2(Fold Change) between the two samples indicated on the top or on the right of the figure, while the vertical axis represents the log10(p value) for the differential expressions between the two samples. Each point represent a gene, red points indicate p value ≤ 0.05, while blue points indicate that p value > 0.05.

