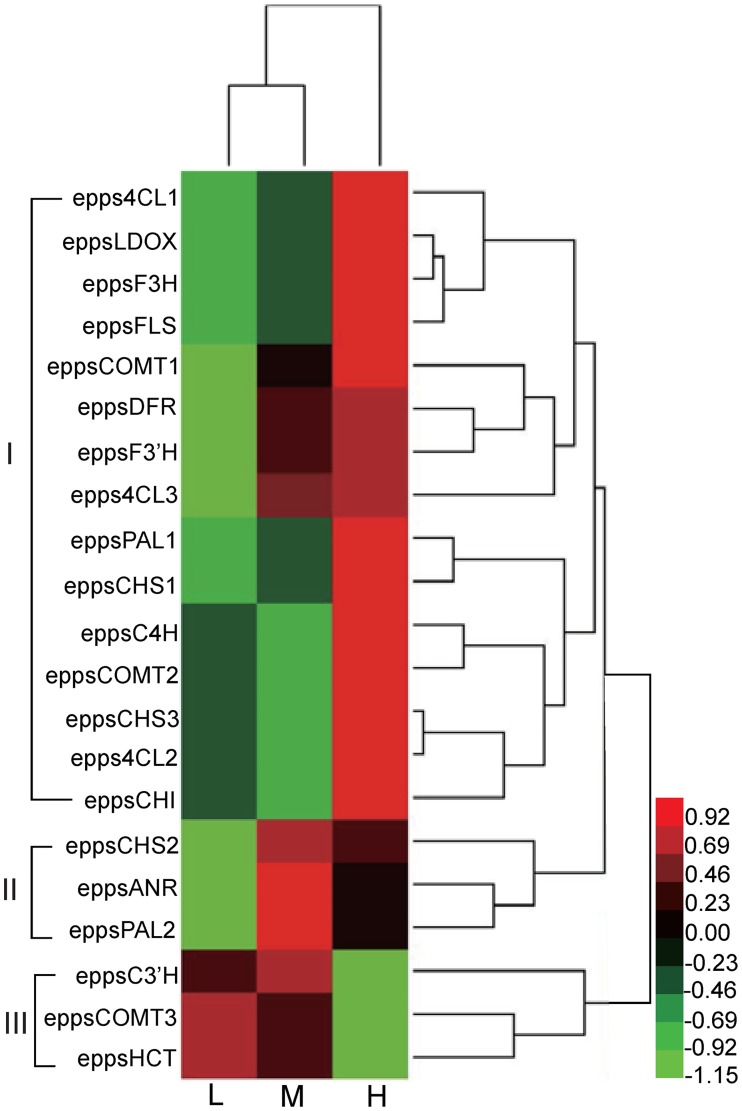
Fig 8. Hierarchical clustering of 21 flavonoid biosynthesis genes.
Red, green and black colors in the heat-map represent relative gene expression levels. The scale bar denotes the log (FPKM+1)/(mean expression levels across the three treatment groups). The green color indicates down-regulated expression compared with the mean expression levels, and the red color indicates up-regulated expression compared to the mean. Three clusters (I, II and III) were indicated with brackets.

