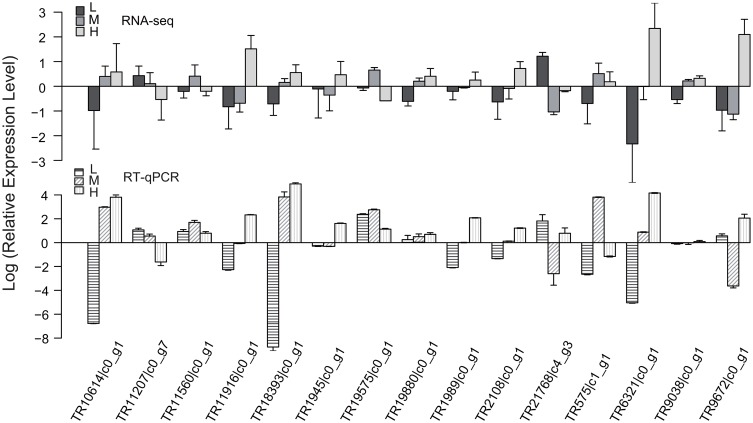
Fig 9. Comparison of the expression patterns of fifteen genes obtained from RNA-seq experiments with those obtained from RT-qPCR experiments.
Relative expression values, normalized to actin, were shown as 2−ΔΔCt relative to mean of the L, M and H treatments. Error bars represent the SD of three biological replicas with three technical replicas each.

