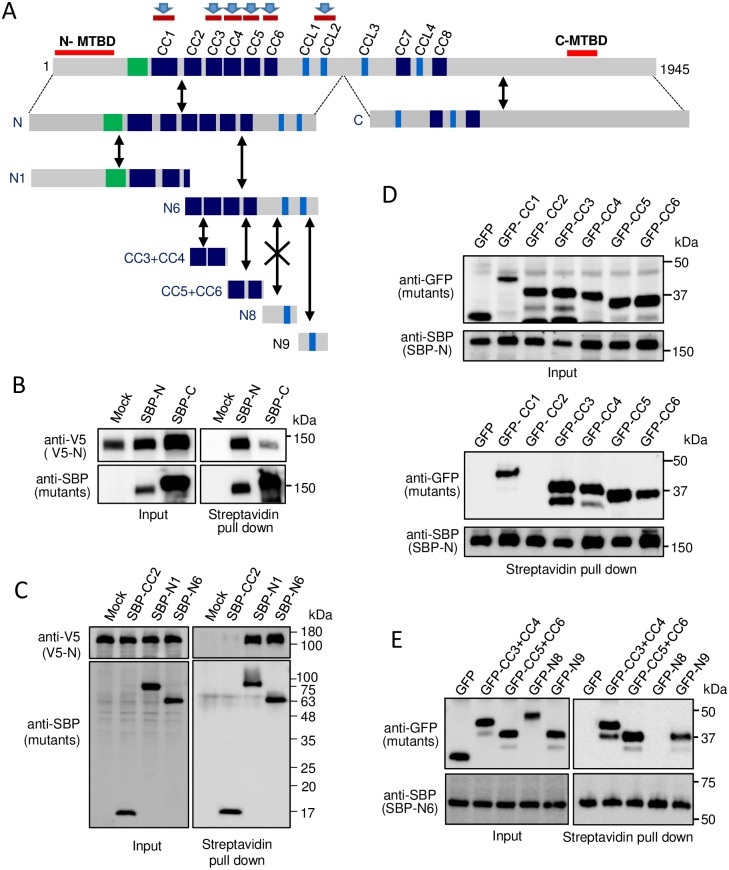
Fig 3. Identification of homo-interaction regions in the N-terminal half of MTCL1.
(A) Schematic representation of the MTCL1 mutants used in the following experiments and the summary of results. Bidirectional black arrows indicate binding, and that with a cross mark indicates no binding. Brown bars with a blue arrow (top) indicate the identified homo-interaction regions. (B) Streptavidin pull-down assays performed with extracts of HEK293T cells co-expressing SBP-N or C and V5-tagged N. (C) Streptavidin pull-down assays performed with extracts of HEK293T cells co-expressing SBP-tagged CC2, N1 or N6 and V5-tagged N. CC2 was included to verify the specificity of the interactions. (D) Streptavidin pull-down assays performed with extracts of HEK293T cells co-expressing SBP-tagged N and individual N-terminal CCs with a GFP tag. (E) Streptavidin pull-down assays performed with extracts of HEK293T cells co-expressing SBP-tagged N6 and GFP-tagged CC3+CC4, CC5+CC6, N8, or N9.

