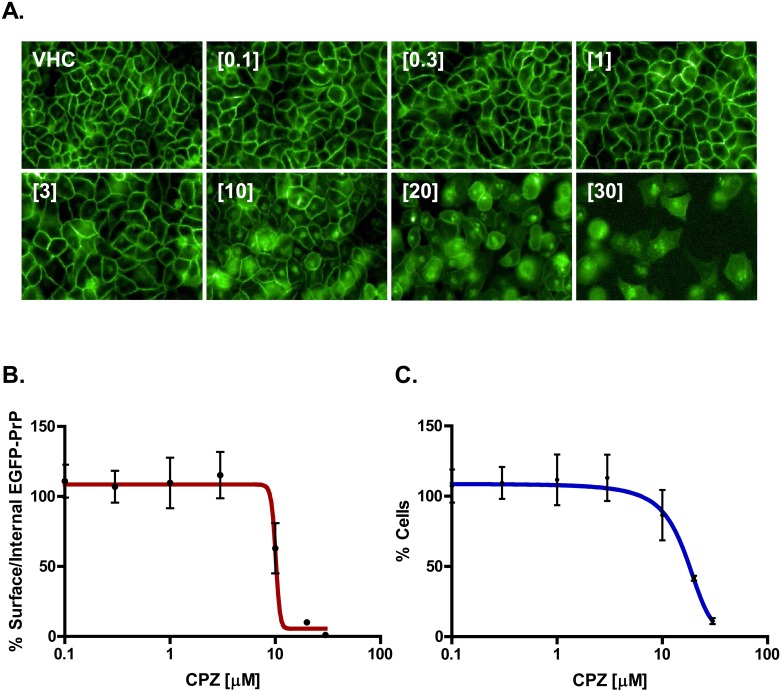
Fig 7. Semi-automatic detection of EGFP-PrPC distribution upon CPZ treatment.
A. HEK293 cells stably expressing EGFP-PrPC were grown to ~80% confluence on 384-well plates, and then incubated with the indicated concentration of CPZ for 24h. An Operetta High-Content Imaging System was then employed to calculate the cell surface vs intracellular amount of EGFP-PrPC. B. The graph shows the mean percentage of cells (± standard deviation) showing a ratio of membrane vs intracellular EGFP-PrPC signal higher than 1.5, after treatment with raising concentrations (indicated) of CPZ. C. The graph shows the mean percentage (± standard deviation) of the total number of nuclei detected in each well by Hoechst staining, after treatment with raising concentrations (indicated) of CPZ.

