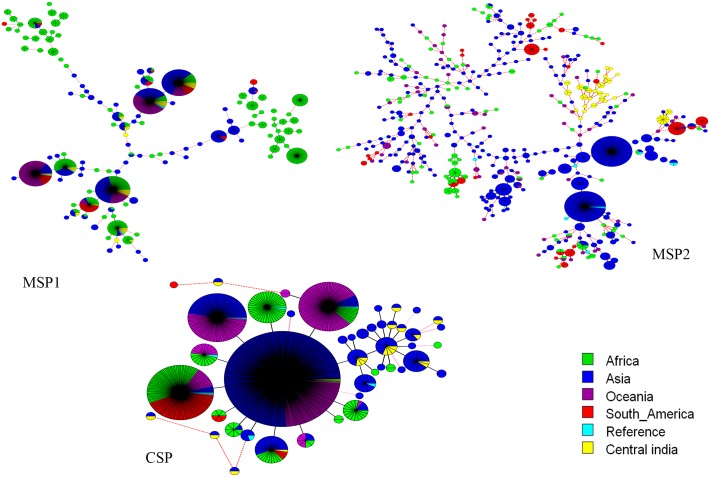
Fig 4. Global population structure of P. falciparum msp1, msp2 and csp gene.
A minimal spanning tree (MST) generated using Bio Numerics software version 7.6.1 showing the relationship from worldwide isolates. Each circle represents and individual haplotype and the size of the circle is proportional to the number of isolates belonging to that haplotypes. The line connecting the circle is branch length.

