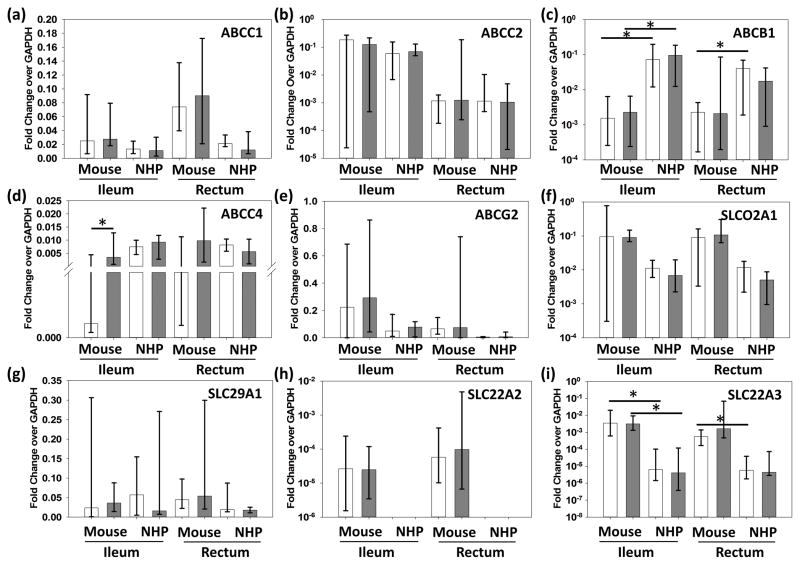
Figure 1. Multispecies Comparison of Transporter Gene Expression.
Gene expression is represented as fold change of GAPDH for uninfected (white) and infected (gray) animals from multiple dosing cohorts. Data shown are median and range. SLC22A2 was observed in mouse tissues only. NHP=non-human primate; * represents p<0.05.

