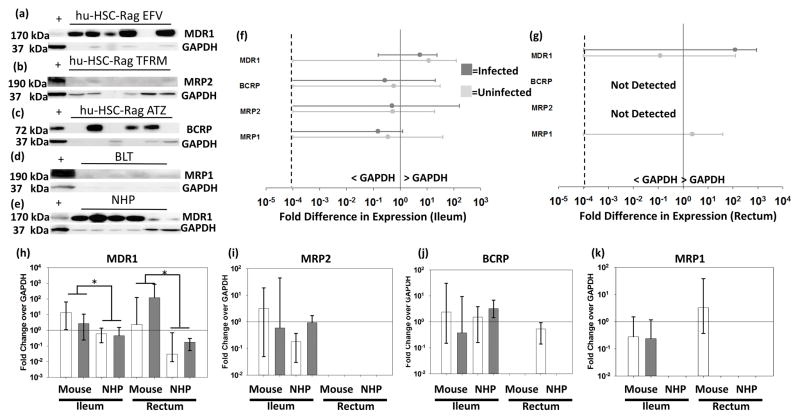
Figure 2. Transporter Protein Expression Humanized Mice Ileum and Rectum.
Representative Western blots for four efflux transporters from each animal cohort (A–E). + represents the positive control sample. Samples with no detectable GAPDH were not included in subsequent analyses. Densitometry data from each blot was quantified for each transporter in mice (F[ileum]&G[rectum]), where protein expression is represented as a fold change over GAPDH for uninfected (light gray) and infected (dark gray) animals. Zero values were imputed at 10−4 (dashed line) for graphing purposes. Comparison of all mice and macaques is shown in H–K, where data are median and range. Solid line represents equal protein expression to GAPDH; * represents p<0.05.

