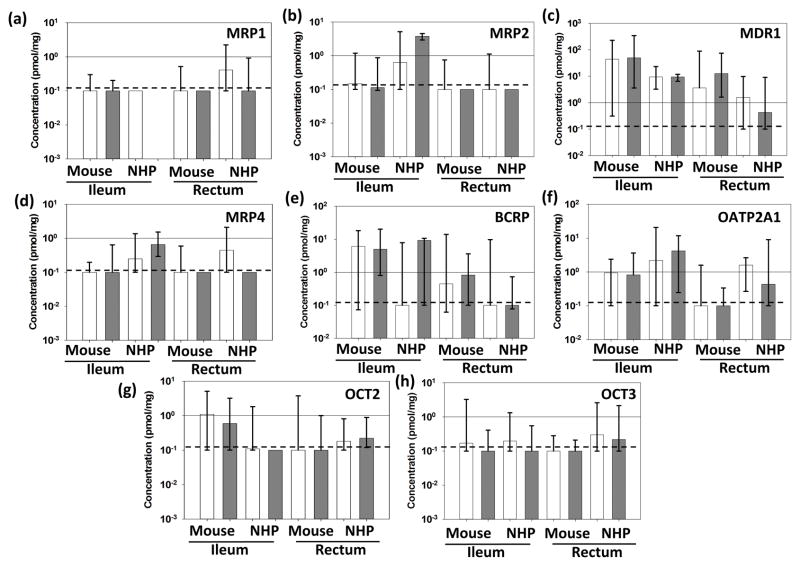
Figure 3. Multispecies Comparison of Transporter Protein Expression by QTAP.
Absolute protein concentrations are represented as pmol/mg protein for uninfected (white) and infected (gray) animals from multiple dosing cohorts. Solid lines represent 1pmol/mg; dashed lines represent the lower limit of quantitation. Data shown are median and range; * represents p<0.05.

