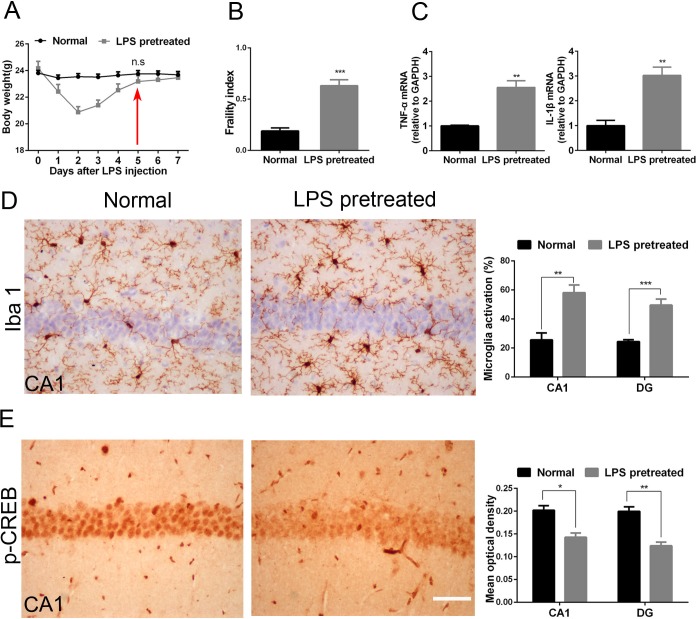
Fig 1. LPS pretreated mice exhibit higher physical frailty index and brain vulnerability than age-matched normal adult mice.
(A) The trends of mice’s weight after received LPS intraperitoneal injection; (B)The performance-based eight-item frailty index. One-way ANOVA; Normal vs. LPS pretreated, p<0.001; n = 12 per group. (C) RT-PCR of TNF-α and IL-1β in the hippocampus. unpaired Student’s t-test; p = 0.004 for TNF-α; p = 0.007 for IL-1β; n = 3 per group. (D) Activated microglia of hippocampal CA1 and DG in normal mice and LPS pretreated mice. unpaired Student’s t-test; p = 0.002 in CA1; p<0.001 in DG; n = 4 per group (E) P-CREB expression in CA1 and DG of hippocampus in normal mice and LPS pretreated mice. unpaired Student’s t-test; p = 0.01 in CA1; p = 0.003 in DG; n = 3 per group. LPS pretreated mice correspond to 5 days survivors. All data were presented as mean±SEM; *p<0.05, **p<0.01, ***p<0.001. Bar = 50μm.

