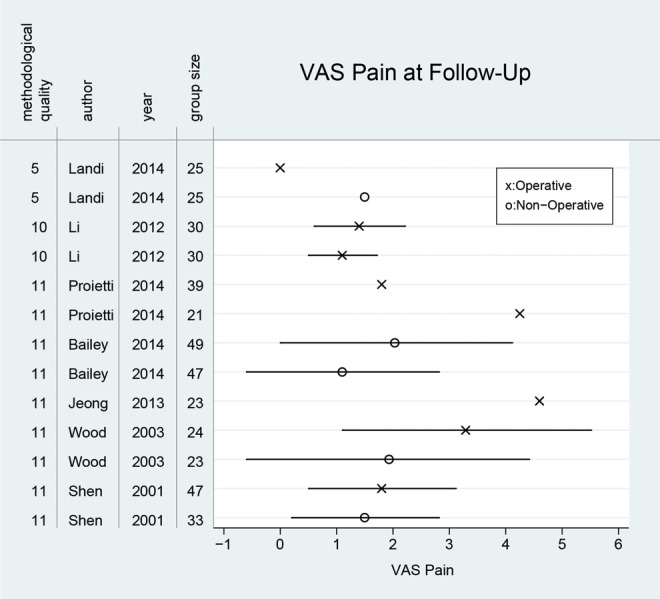
Figure 5.

Results and treatment group sizes of all studies reporting pain visual analog scale (VAS) presented in the order of methodological quality. X and Ο represent the pain VAS mean values and the bars represent the standard deviation (as far as reported).
