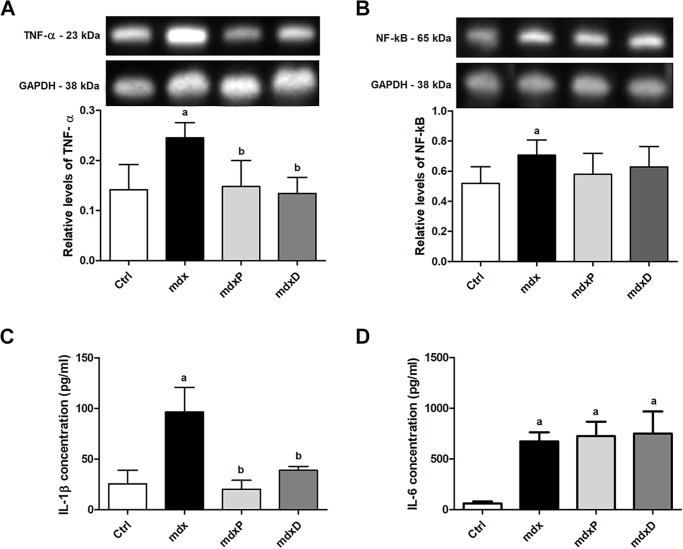
Fig 3. Factor and inflammatory cytokines involved in dystrophic process.
Western blotting analysis of tumor necrosis factor alpha (A, TNF-α), and nuclear factor-kappa (B, NF-κB). The blots of the proteins (top row) and of glyceraldehyde-3-phosphate dehydrogenase (loading control, bottom row), are shown. The graphs show protein levels in the crude extracts of diaphragm (DIA) muscle from C57BL/10 mice (Ctrl), saline-treated mdx mice (mdx), prednisone-treated mdx mice (mdxP) and diacerhein-treated mdx mice (mdxD). The intensities of each band were quantified and normalized to those of the corresponding Ctrl. Relative values are expressed as mean ± standard deviation (SD). Detection of IL-1β (C) and IL-6 (D) levels in serum of Ctrl, mdx, mdxP and mdxD groups. aP ≤ 0.05 compared with Ctrl mice, bP ≤ 0.05 compared with mdx mice (one-way ANOVA with Tukey’s post-hoc test).

