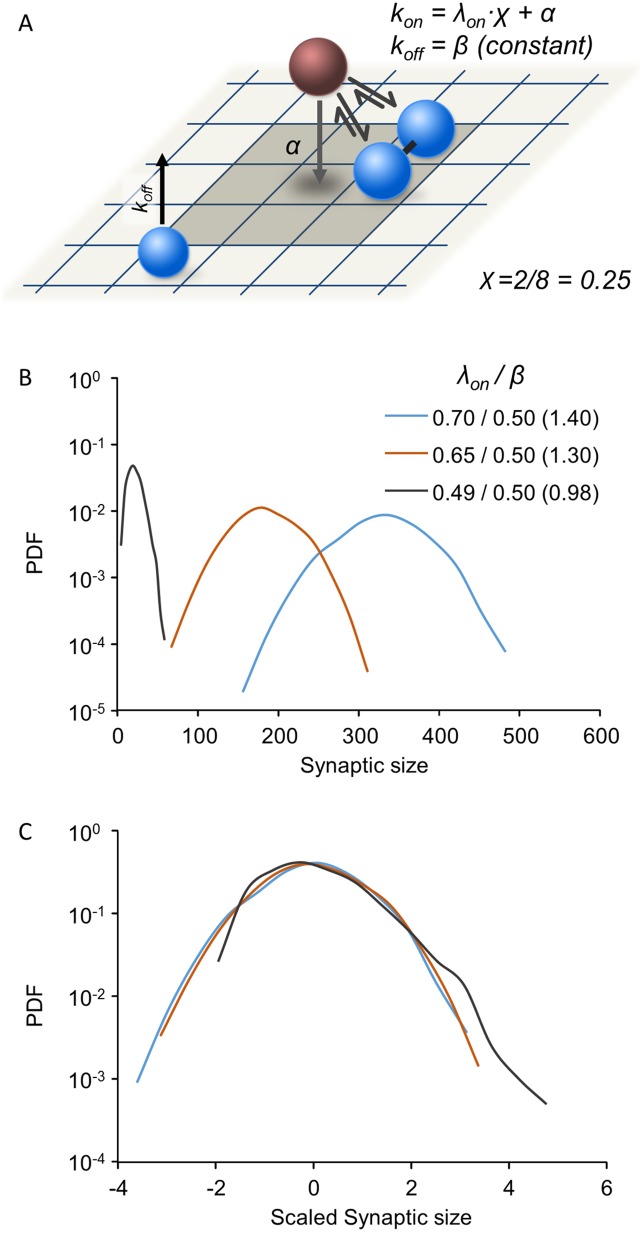
Fig 4. Synaptic size distributions in the Contact Process model.
(A) Illustration of the Contact Process: Binding is cooperative with a rate that increases with the fraction of occupied neighboring sites (representing interactions with nearby bound molecules) whereas the unbinding rate is a constant, β, insensitive to the numbers of occupied neighboring sites. Binding is also affected by a small, constant and non-cooperative component (α) representing weak, non-specific binding to the matrix. (B) Synaptic size distributions for different λon/β ratios. All distributions were determined numerically through simulations (3500 synapses, 1500 time steps; see Methods for further details). Note the semi-logarithmic scale. (C) Same distributions as in (B) after scaling by subtracting the mean and dividing by the standard deviation. See Methods for the rest of the simulation parameters used here.

