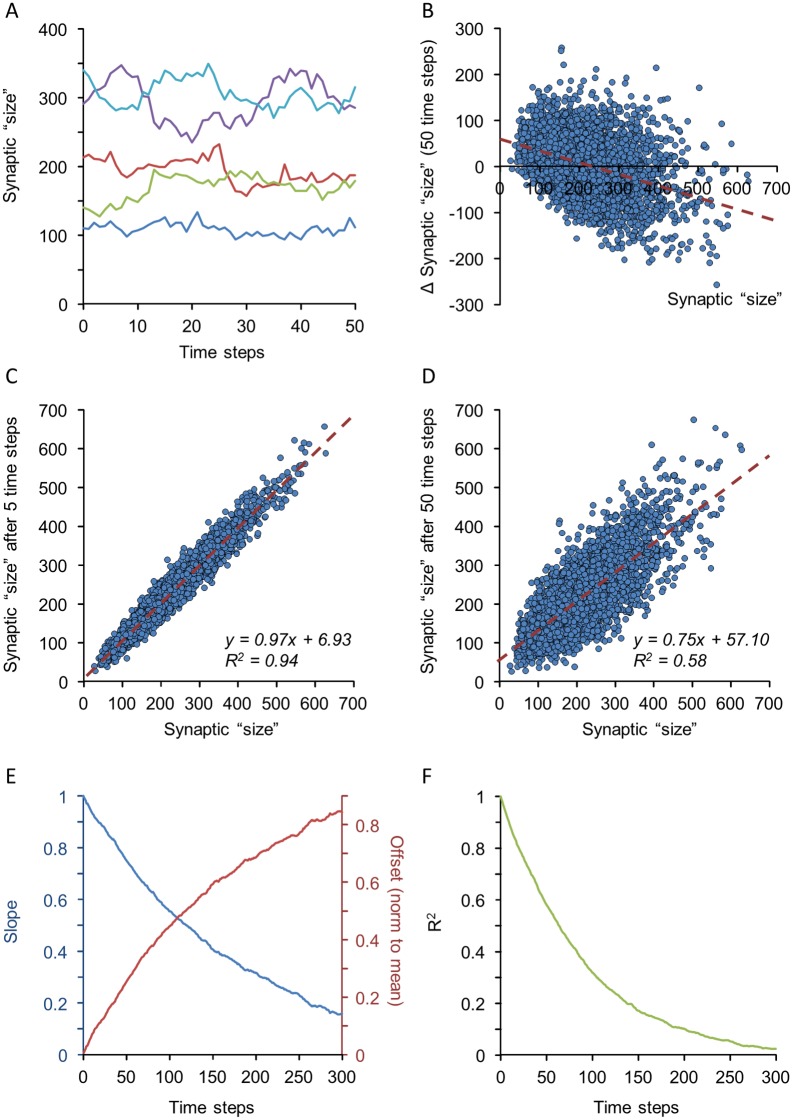
Fig 7. Synaptic size dynamics in the bidirectional cooperativity model.
(A) Sizes of 5 simulated synapses over 50 simulation time steps. Note the fluctuations in simulated synapse size over the course of the simulation. (B) Scatter plot of changes in synapse size as a function of initial size after 50 time steps (3,500 synapses). (C,D) Changes over time of synaptic sizes for the same synapses after 5 (C) and 50 time-steps (D). Dashed red lines represent linear regression fits, with fit coefficients shown in the figure. (E) Slopes and offsets of linear regression lines in plots such as those of C and D for 300 consecutive time steps. Offsets were normalized to mean synaptic size during this 300 time-step window. (F) Coefficients of determination (R2) in plots such as those of C and D for 300 consecutive time steps. All data were obtained after mean synaptic size plateaued at ~225 bound molecules (after about 900 steps). See Methods for simulation parameters.

