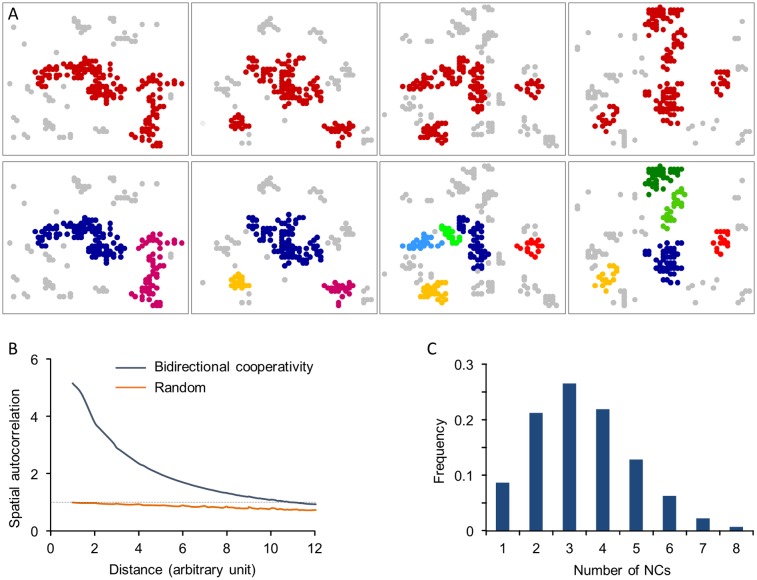
Fig 8. Spatial patterns of bound molecules and their evolution in the bidirectional cooperativity model.
(A) “Time-lapse” images of molecules bound to the matrix. In the top panel, clusters are marked in red while sparse molecules in gray. In the bottom panel, clusters were separated using a hierarchical clustering algorithm (see Methods) with each cluster colored separately, allowing individual clusters to be followed over time. Time difference between consecutive frames is 10 steps. (B) Autocorrelation functions of synaptic structures obtained from the bidirectional cooperativity model and randomly distributed molecules. (C) Distribution of “nanocluster” numbers per synapse. See Methods for simulation details.

